2020 Q2 Powersports Market Report
Industry Overview
Powersports Market Update
Most segments of the Powersport industry rebounded nicely from the early stages of the nationwide shutdown, with all but sportbikes showing a typical seasonal increase in pricing.
In the motorcycle segment, cruisers recovered their steep early spring decline and are now averaging only 1% lower pricing than last year. Sportbikes were not quite as impressive, with no May June rebound. However, average pricing for this segment is still 1.7% ahead of last year.
Side-by-sides looked strong in the May June period, with the utility segment nicely outperforming May June 2019 by 2.8% on average, although still slightly behind 2018 levels. The sport segment continues to bring pricing stronger than in the last two years, 4.3% ahead of 2019 and 1.0% ahead of 2018.
Since enjoying motorcycles and side-by-sides is a mostly solo endeavor, our industry is largely unaffected by the need to social distance. Pricing in the most recent period suggests buyers are eager to get back on the roads and trails.
Powersport Values
Average Retail Value by Category - Values for the Last 10 Model Years
Cruisers

Sportbikes

Utility Side By Sides

Sport Side By Sides

Powersport Values vs. Traffic
Average Retail Value and Traffic Views by Category
Cruisers

Sportbikes

Utility Side By Sides

Sport Side By Sides

Powersport Categories
Category Views Among Consumers, Dealers, and Finance & Insurance Institutions in 2020 Q1-Q2

Motorcycle Brands
NADAguides.com Top Researched Brands in 2020 Q1-Q2
Cruiser Brands

Touring Brands

Sportbike Brands

Off-Highway Brands

Off-Road Vehicle Brands
NADAguides.com Top Researched Brands in 2020 Q1-Q2
All-terrain Vehicle Brands

Side By Side Brands

Model Years
NADAguides.com Top Researched Model Years by Category
Sportbikes

Utility Side By Sides

Web Traffic by State
NADAguides.com Traffic by State in 2020 Q1-Q2
Motorcycles

| > 75,000 | |
| 55,000 - 75,000 | |
| 39,000 - 54,999 | |
| < 39,000 |
Side By Sides

| > 20,000 | |
| 10,000 - 20,000 | |
| 5,000 - 9,999 | |
| < 5,000 |
Fuel Price Data
Regular Grade Gasoline Prices vs. Consumer Traffic by Category
Motorcycles

Side By Sides

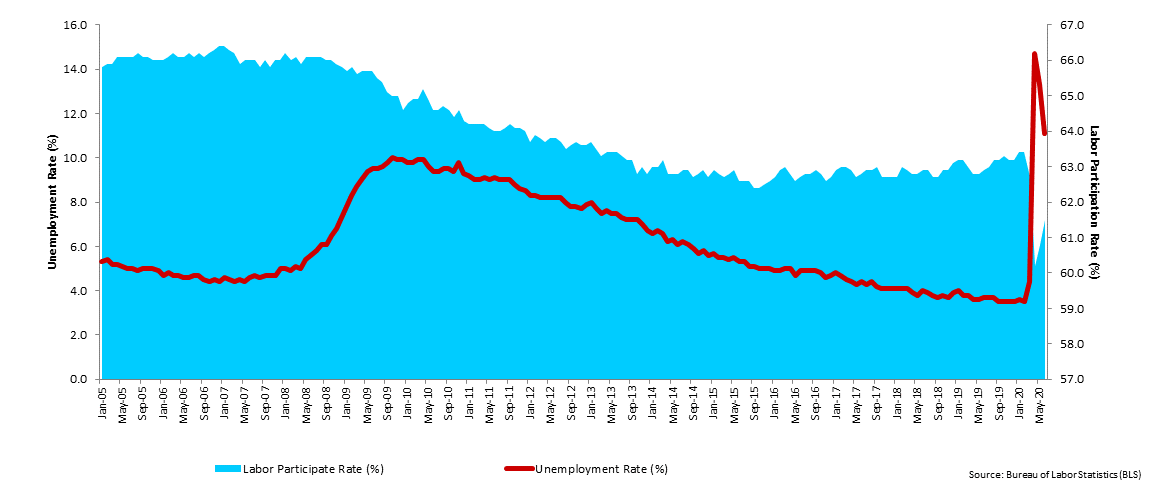
Economic Data
Unemployment & Labor Participation Rate (Seasonally Adjusted)
JD Power / NADAguides
Disclaimer
NADAguides, a division of JD Power, makes no representations about future performance or results based on the data and the contents available in this report (“Market Insights”). Market Insights is provided for informational purposes only and is provided AS IS without warranty or guarantee of any kind. By accessing Market Insights via email or the NADAguides website, you agree not to reprint, reproduce, or distribute Market Insights without the express written permission of NADAguides.
About NADAguides.com
NADAguides.com, the largest publisher of the most market-reflective vehicle pricing and information available for new and used cars, classic cars, motorcycles, boats, RVs and manufactured homes, offers in-depth shopping and research tools including a broad range of data, products and service and informational articles as well as tips and advice. NADAguides.com also produces electronic products, mobile applications, raw data, web services, web-syndicated products and print guidebooks. NADAguides.com is operated by NADAguides, a division of JD Power.