2020 Year-End Review Marine Industry
Marine Market Industry Overview
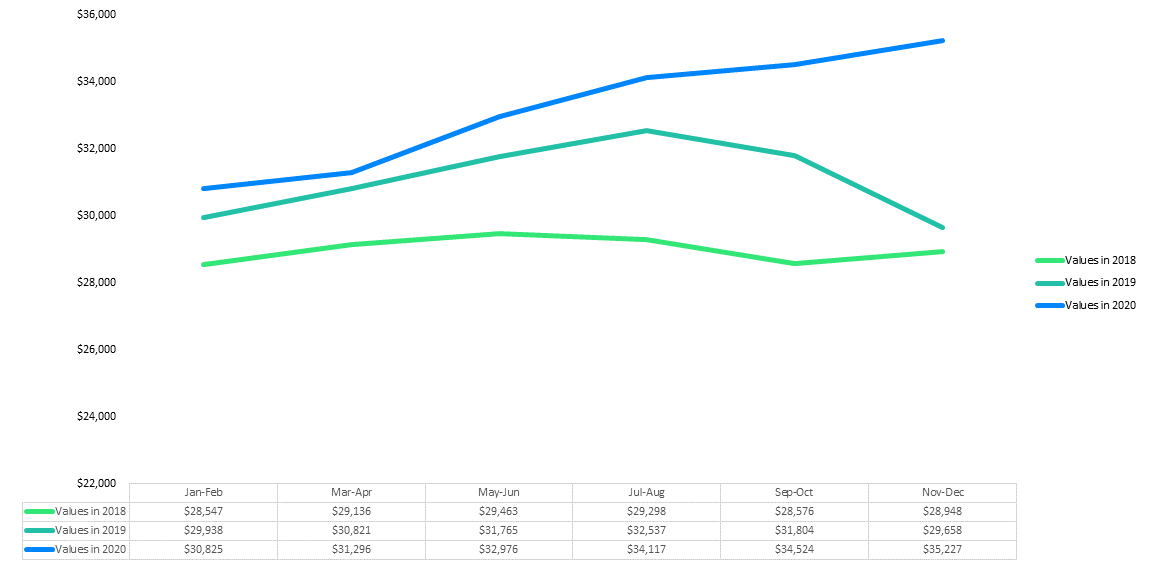
All segments of the marine industry finished 2020 strong, with values increasing in the second half of the year, and no seasonal pullback in values.
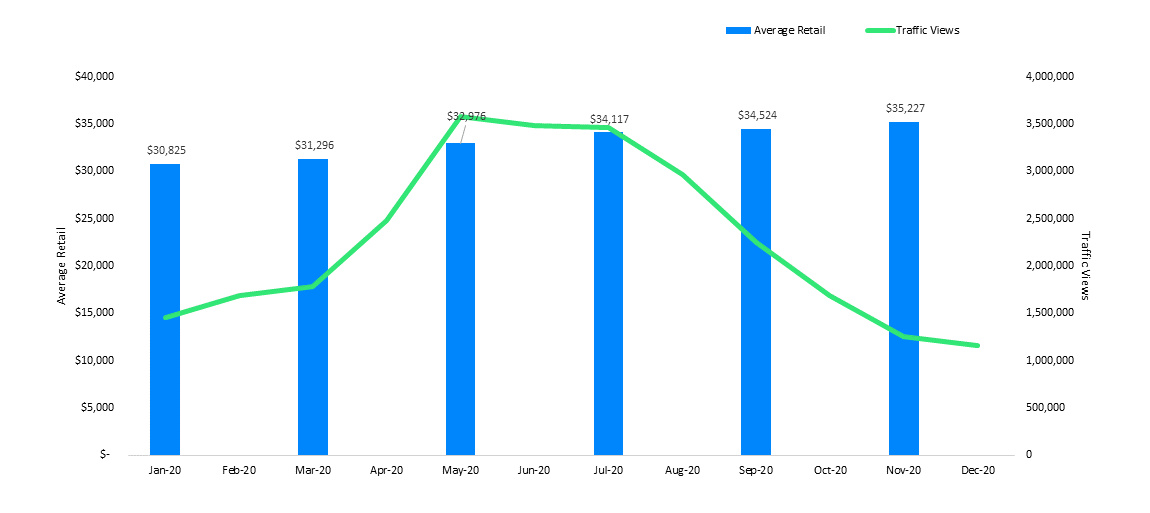
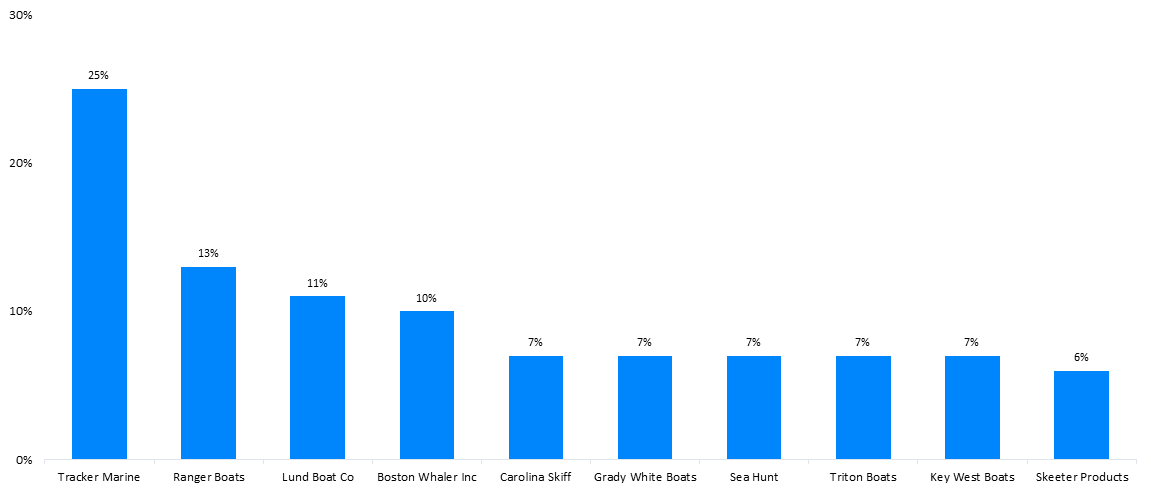
Looking at individual segments, outboards brought 6.7% more money in 2020 than in 2019, with the gap increasing in the second half. Tracker Marine was our mostresearched make.
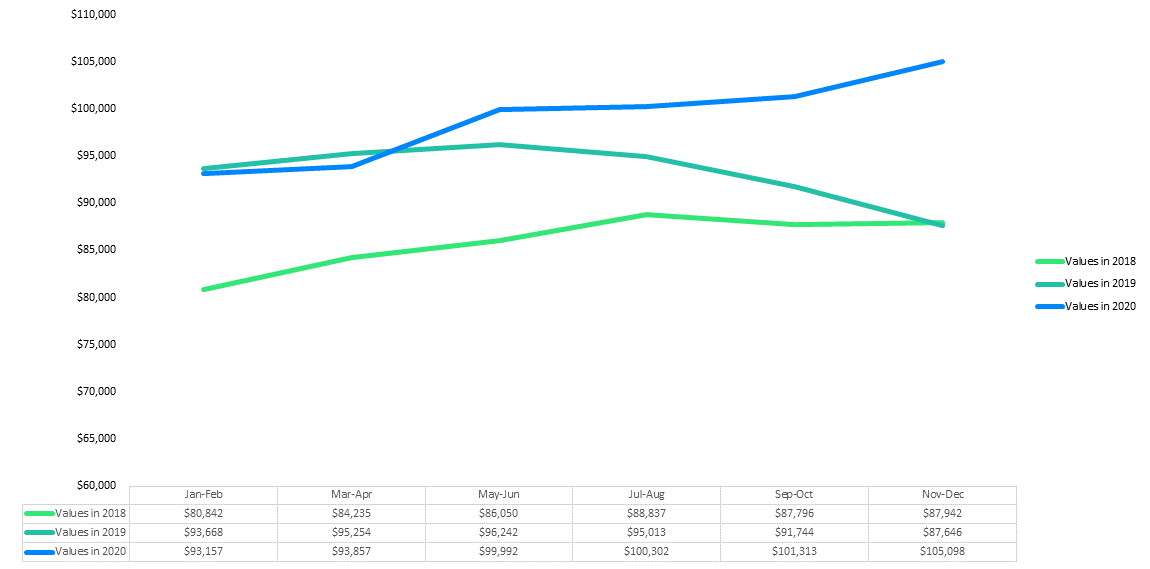
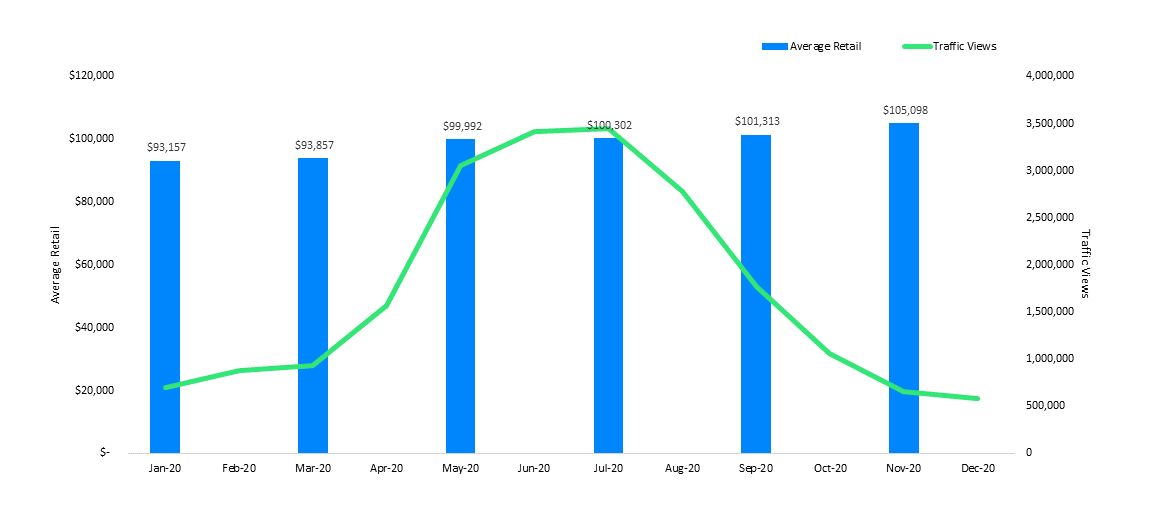
Stern Drives brought 6.1% more money year-over-year, with our average value for the most recent 10 model years cresting the 6-figure mark in the second half of the year. Sea Ray was our most-researched make in 2020.
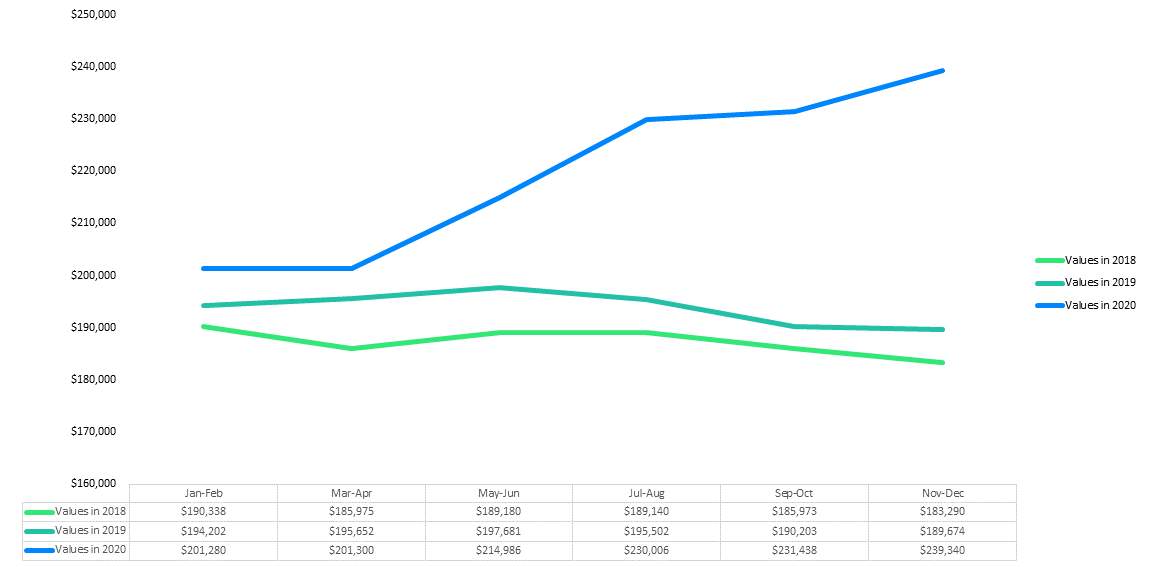
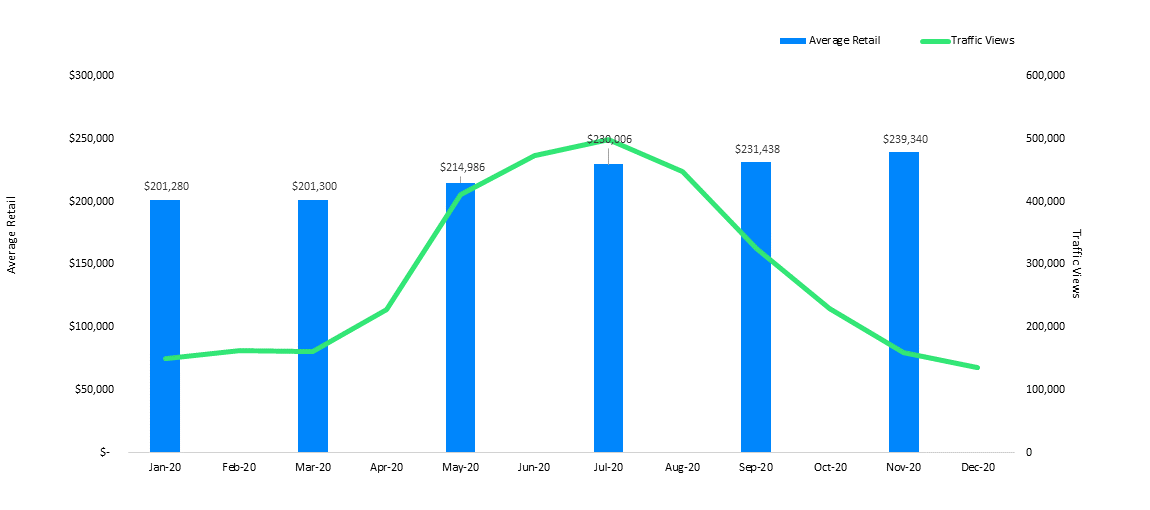
Inboard values really took off in 2020, finishing the year 13.5% ahead of 2019. Our average value for the most recent 10 model years was over the $200,000 mark all year. Our most-researched brand in 2020 was Master Craft, with Malibu, Correct Craft, and Sea Ray very close.
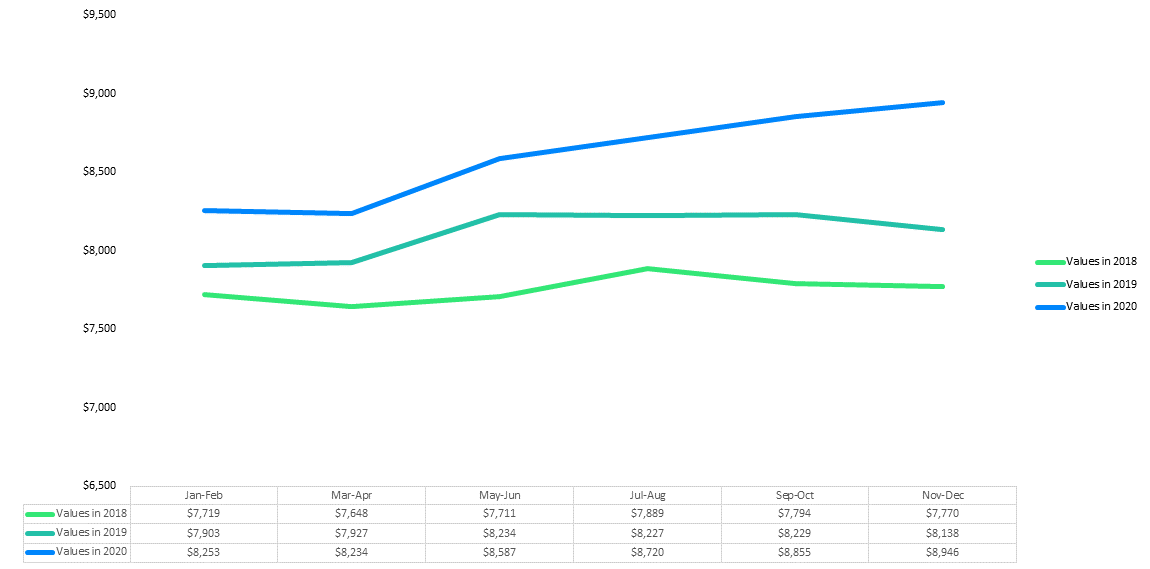
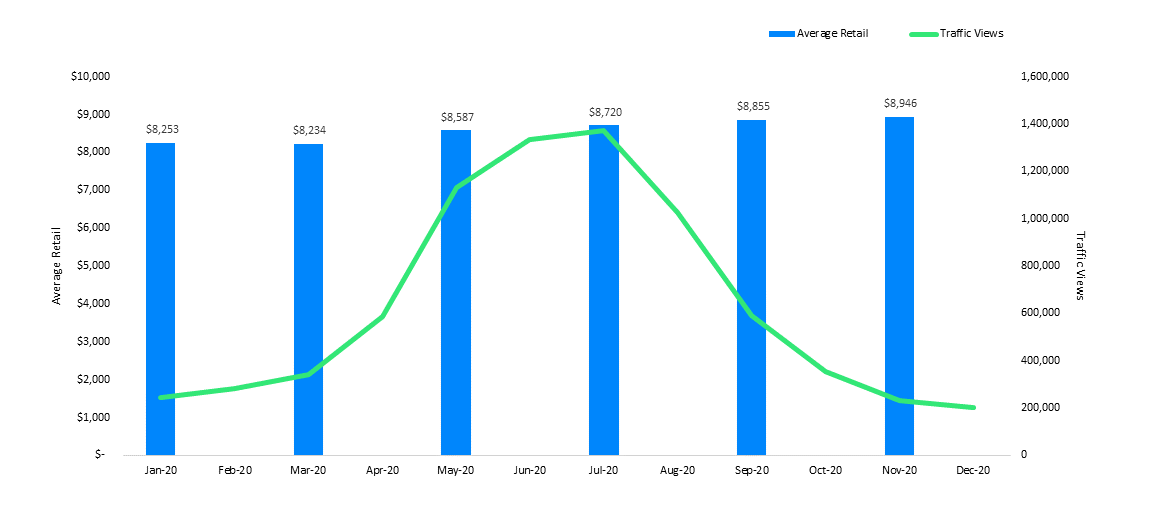
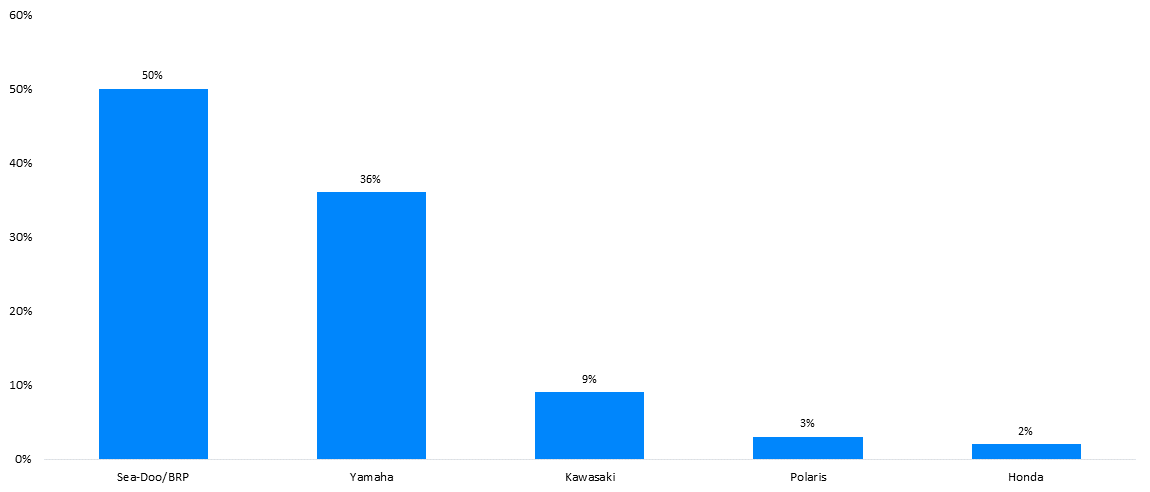
Personal watercraft increased 6.0% in value in 2020 compared to 2019. Our most-researched brand was Sea Doo/BRP.
Boats and personal watercraft continue to benefit from the shift of discretionary funds from travel to recreation. With values remaining strong through the 4th quarter, the marine industry starts 2021 on good footing.
Marine Values
Average Retail Value by Category - Values for the Last 10 Model Years
Outboard Boats
Stern Drive Boats
Marine Values
Average Retail Value by Category - Values for the Last 10 Model Years
Inboard Boats
Personal Watercraft
Power Boat Values vs. Traffic
Average Retail Value and Traffic View by Category
Outboard Boats
Stern Drive Boats
Marine Values vs. Traffic
Average Retail Value and Traffic Views by Category
Inboard Boats
Personal Watercraft
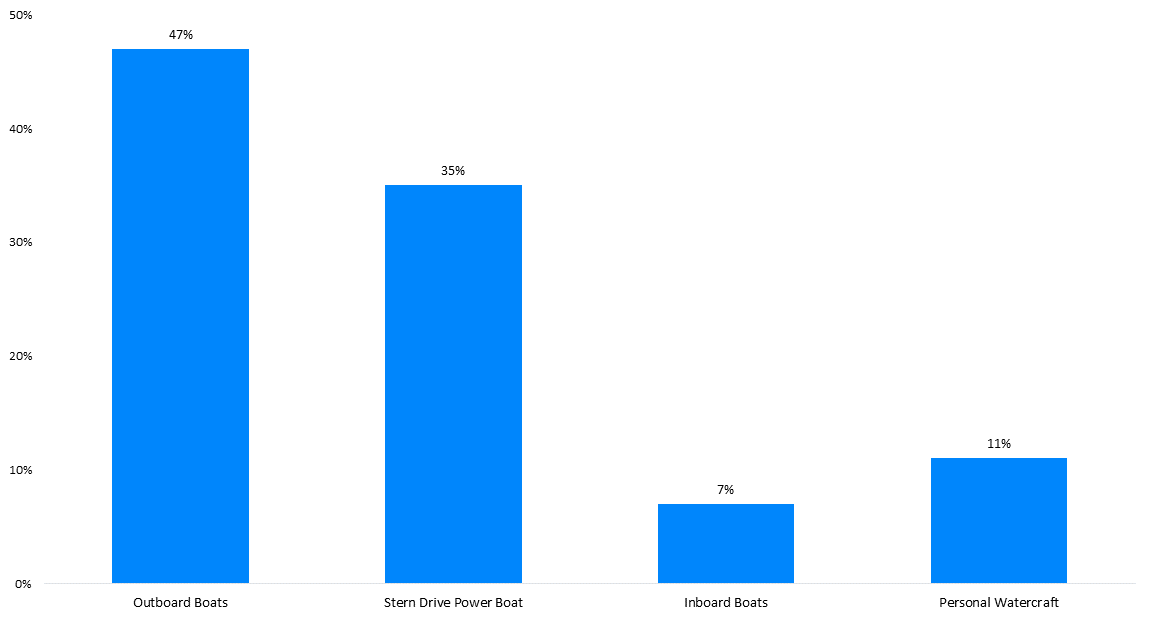
Marine Categories
Category Views Among Consumers, Dealers, and Finance & Insurance Institutions in 2020
Power Boat Brands
Top Researched Brands in 2020
Outboard Brands
Stern Drive Brands

Marine Brands
Top Researched Brands in 2020
Inboard Brands

Personal Watercraft Brands
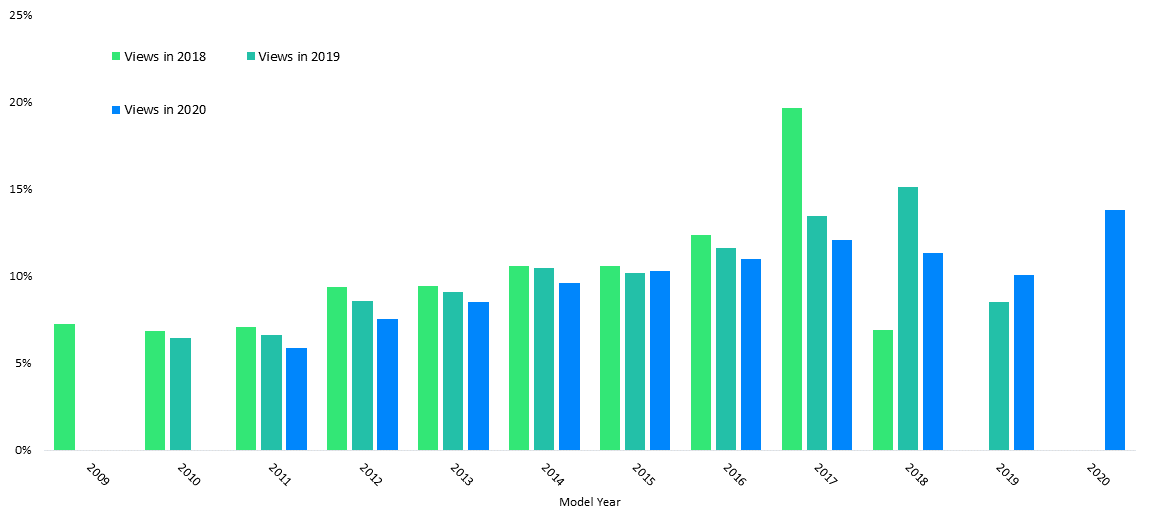
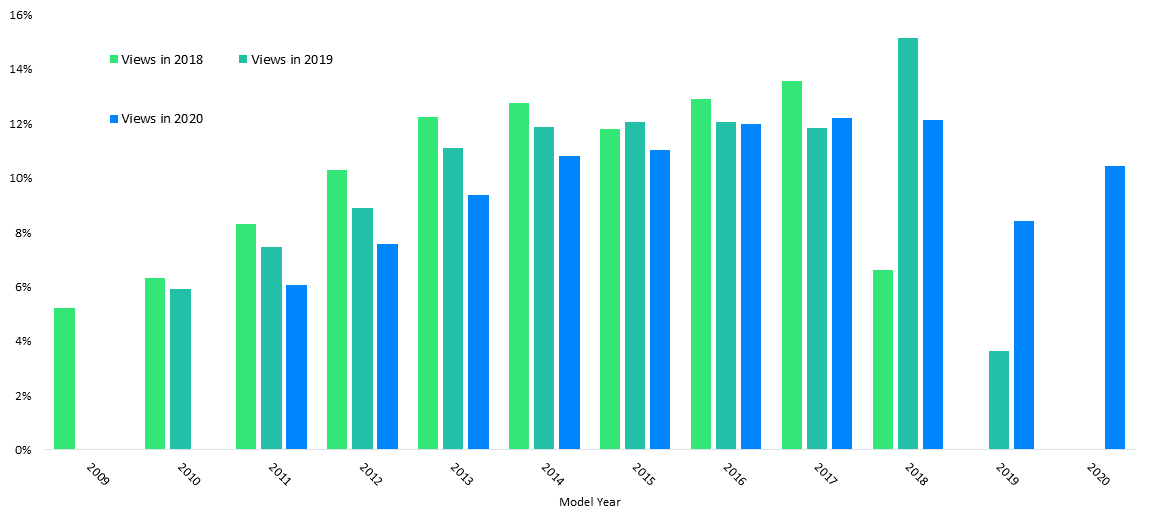
Model Years
Top Researched Model Years by Category
Outboard Boats
Pontoon Boats
Web Traffic by State
Traffic by State in 2020
Outboard Boats
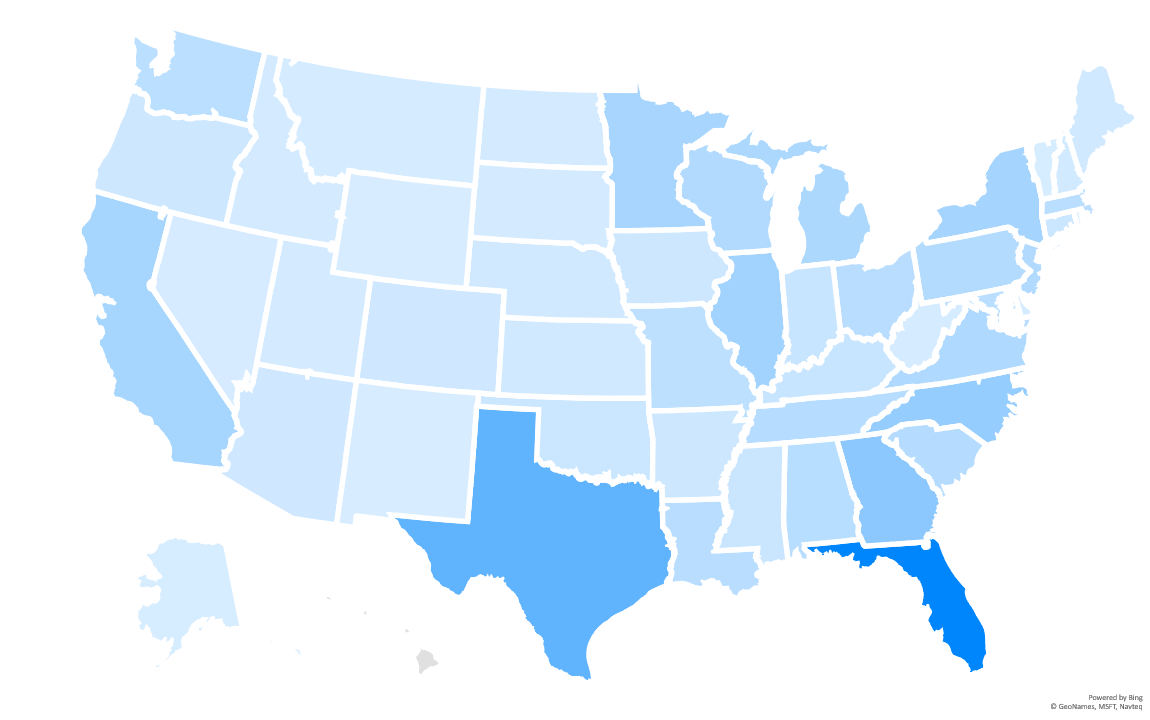
| > 600,000 | |
| 350,000 - 600,000 | |
| 115,000 - 349,999 | |
| < 115,000 |
Pontoon Boats
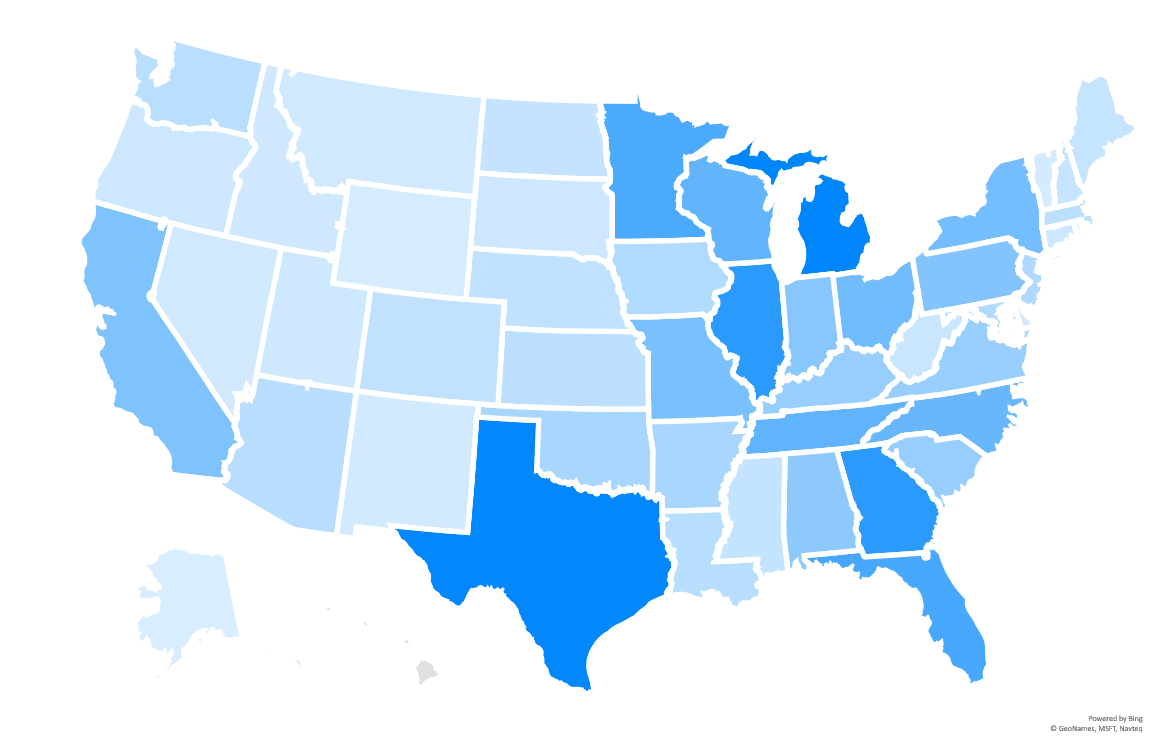
| > 60,000 | |
| 40,000 - 60,000 | |
| 22,000 - 39,999 | |
| < 22,000 |
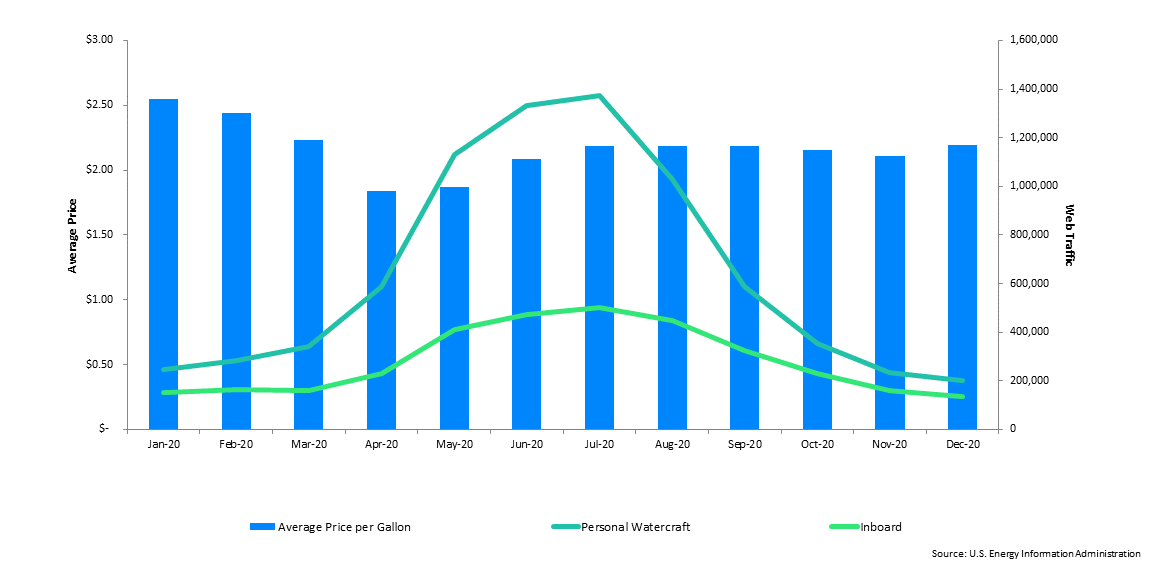
Fuel Price Data
Regular Grade Gasoline Prices vs. Consumer Traffic by Category

Economic Data
Unemployment & Labor Participation Rate (Seasonally Adjusted)

JD Power / NADAguides
Disclaimer
NADAguides, a division of JD Power, makes no representations about future performance or results based on the data and the contents available in this report (“Market Insights”). Market Insights is provided for informational purposes only and is provided AS IS without warranty or guarantee of any kind. By accessing Market Insights via email or the NADAguides website, you agree not to reprint, reproduce, or distribute Market Insights without the express written permission of NADAguides.
About NADAguides.com
NADAguides.com, the largest publisher of the most market-reflective vehicle pricing and information available for new and used cars, classic cars, motorcycles, boats, RVs and manufactured homes, offers in-depth shopping and research tools including a broad range of data, products and service and informational articles as well as tips and advice. NADAguides.com also produces electronic products, mobile applications, raw data, web services, web-syndicated products and print guidebooks. NADAguides.com is operated by NADAguides, a division of JD Power.