2020 Q1 Marine Market Report
Industry Overview
Marine Market Update
Obviously, dealership closures and stay at home orders turned business on its head in March and will continue to do so in the 2 nd quarter. As we continue to assess the fallout, we can track how the Marine industry was doing before and in the early stages of the shutdown.
Heading into the second quarter, values were looking strong. Personal watercraft was the standout, with pricing averaging 4.2% higher in 2020 compared to the same period in 2019. Inboards also saw healthy pricing, averaging 3.3% higher pricing year over year. Other segments were on par with 2019.
It goes without saying that the 2nd quarter will be rough. Dealerships will eventually reopen, and customers will return to the market once stay at home orders are loosened.
Unfortunately this will coincide with the seasonal slowdown in the fall. Also, it is very likely that some of the jobs lost in March and the 2 nd quarter will not come back once the country opens back up 100% later this year. We don’t have an estimate of these permanent losses. That figure will be a key indicator of what degree of recovery to expect.
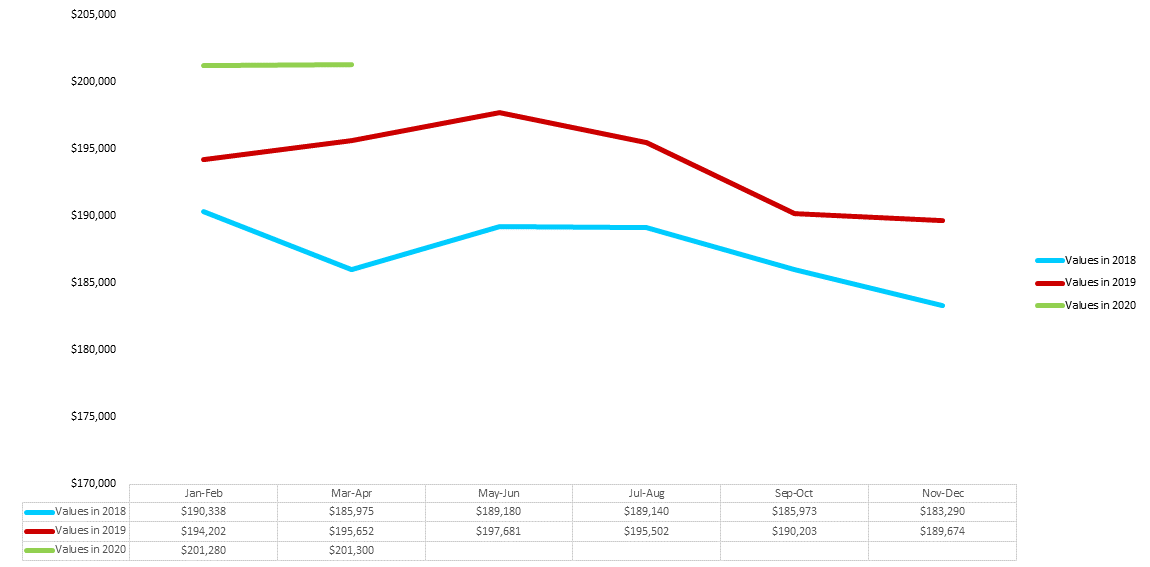
Power Boat Values
Average Retail Value by Category - Values for the Last 10 Model Years
Outboard Boats

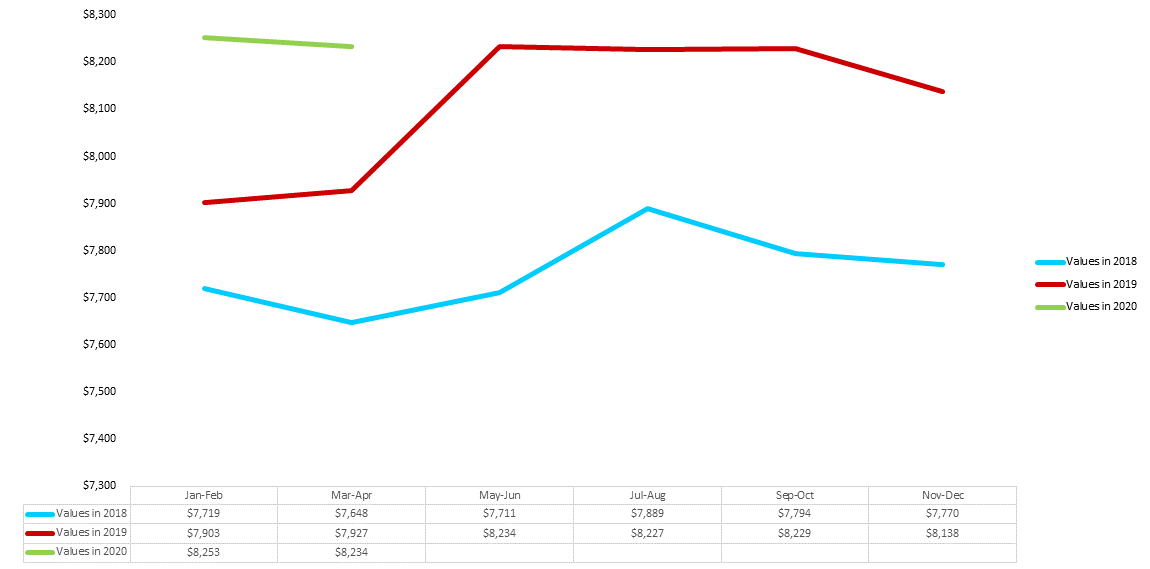
Stern Drive Boats

Marine Values
Average Retail Value by Category - Values for the Last 10 Model Years
Inboard Boats
Personal Watercraft
Power Boat Values vs. Traffic
Average Retail Value and Traffic Views by Category
Outboard Boats

Stern Drive Boats

Marine Values vs. Traffic
Average Retail Value and Traffic Views by Category
Inboard Boats

Personal Watercraft

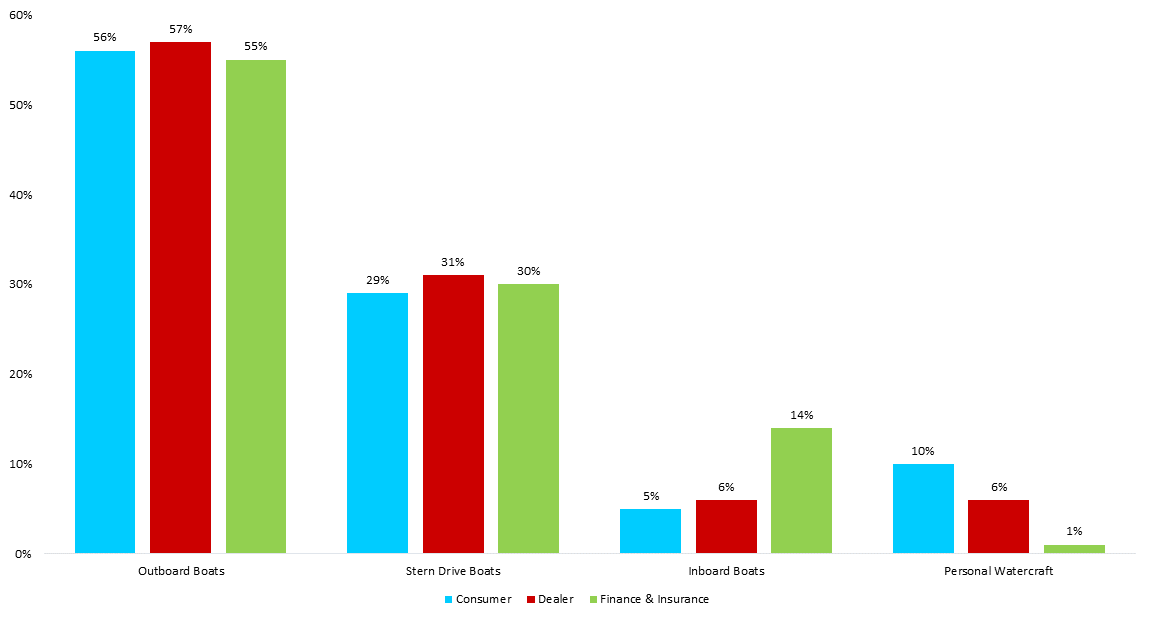
Marine Categories
Category Views Among Consumers, Dealers, and Finance & Insurance Institutions in 2020 Q1
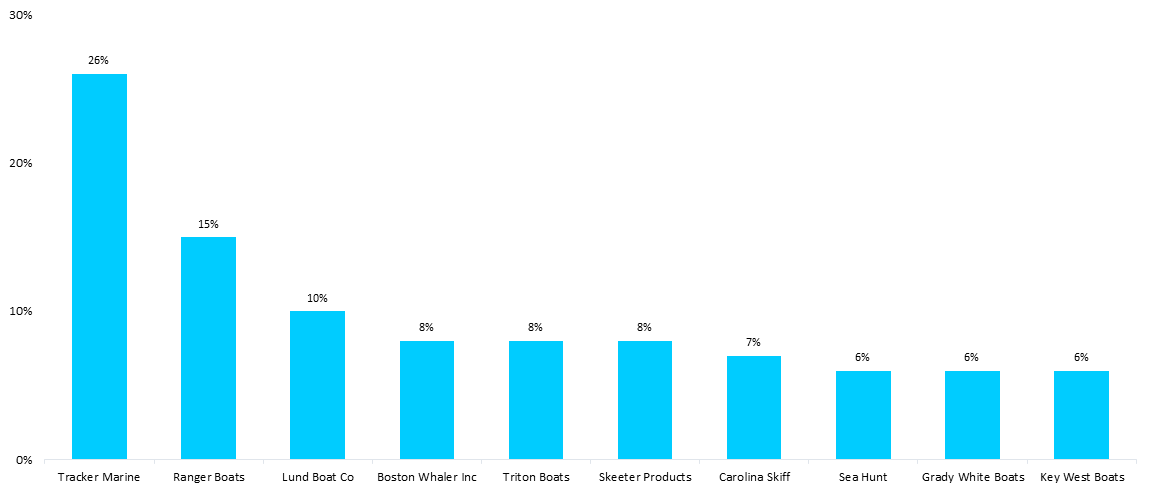
Power Boat Brands
NADAguides.com Top Researched Brands in 2020 Q1
Outboard Brands
Stern Drive Brands
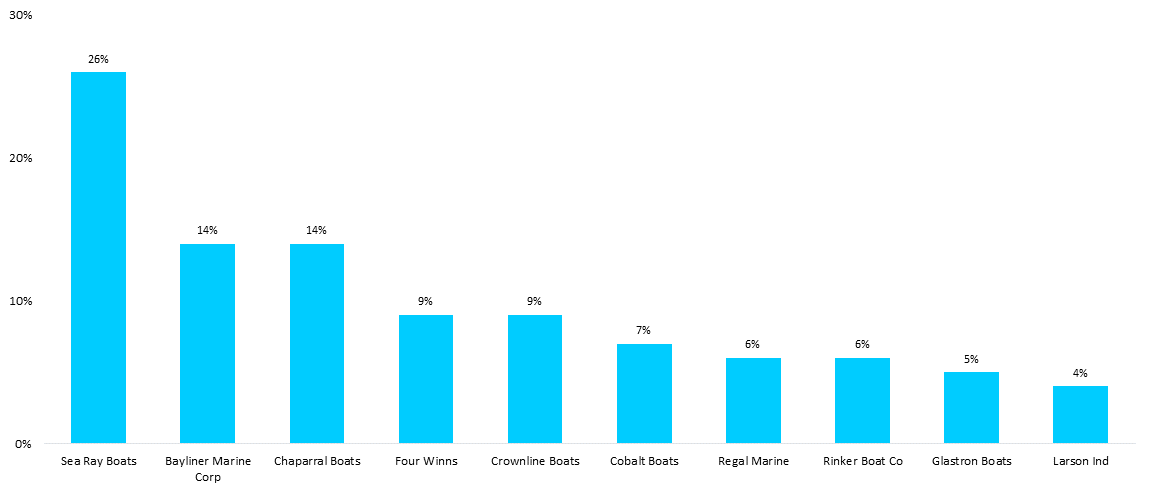
Marine Brands
NADAguides.com Top Researched Brands in 2020 Q1
Inboard Brands

Personal Watercraft Brands

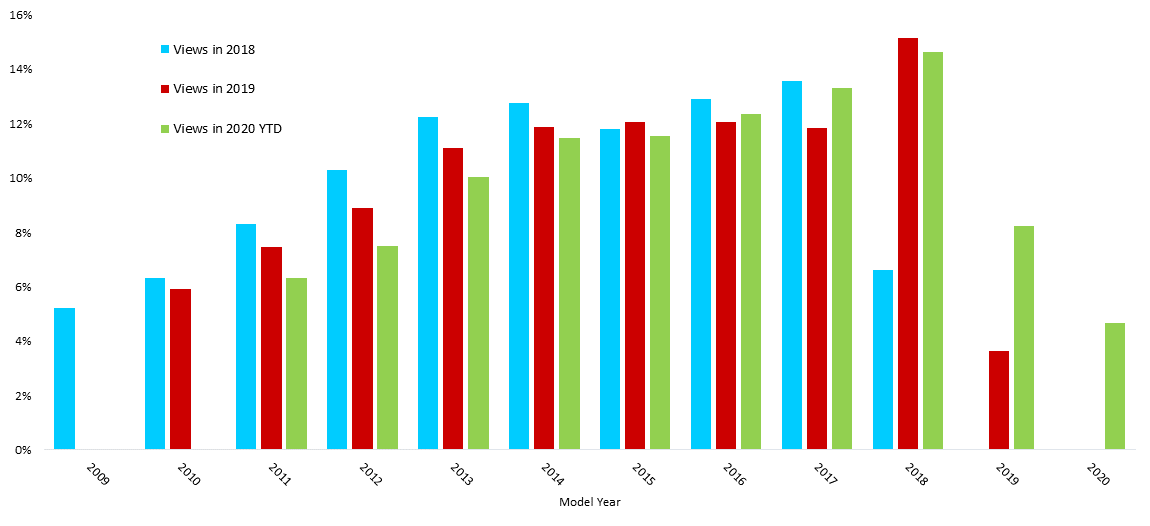
Model Years
NADAguides.com Top Researched Model Years by Category
Outboard Boats

Pontoon Boats
Web Traffic by State
NADAguides.com Traffic by State in 2020 Q1
Outboard Boats
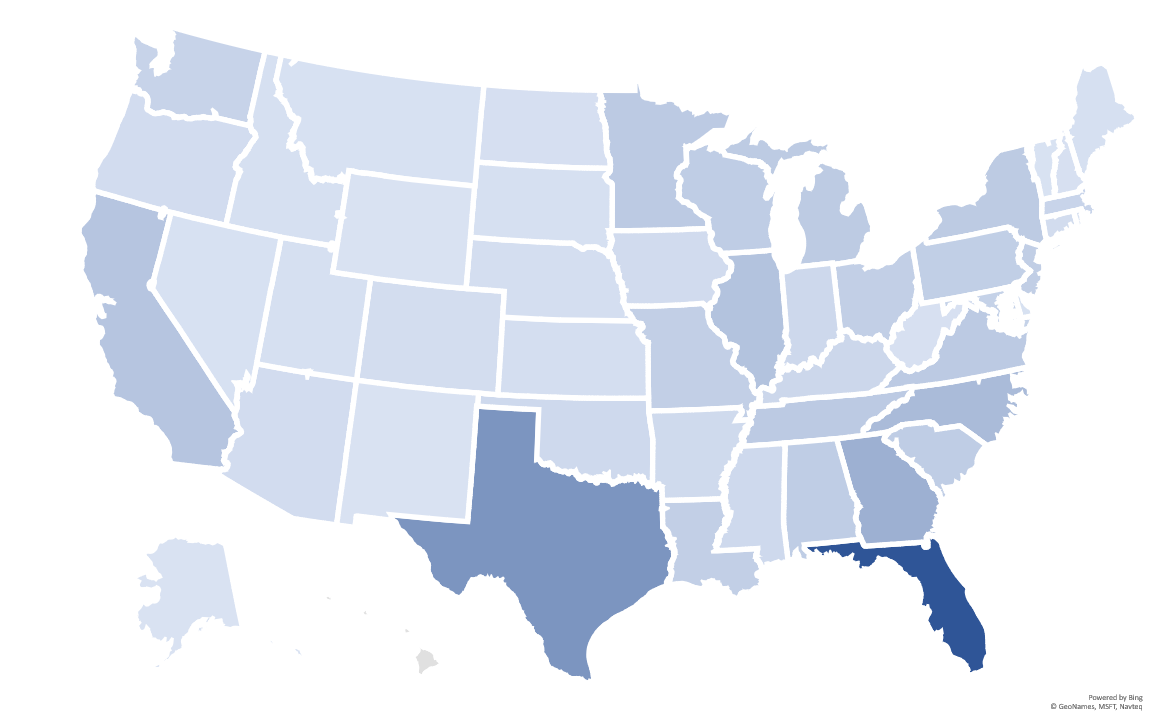
| > 100,000 | |
| 60,000 - 100,000 | |
| 25,000 - 59,999 | |
| < 25,000 |
Pontoon Boats

| > 10,000 | |
| 7,000 - 10,000 | |
| 3,000 - 6,999 | |
| < 3,000 |
Fuel Price Data
Regular Grade Gasoline Prices vs. Consumer Traffic by Category


Economic Data
Unemployment & Labor Participation Rate (Seasonally Adjusted)

JD Power / NADAguides
Disclaimer
NADAguides, a division of JD Power, makes no representations about future performance or results based on the data and the contents available in this report (“Market Insights”). Market Insights is provided for informational purposes only and is provided AS IS without warranty or guarantee of any kind. By accessing Market Insights via email or the NADAguides website, you agree not to reprint, reproduce, or distribute Market Insights without the express written permission of NADAguides.
About NADAguides.com
NADAguides.com, the largest publisher of the most market-reflective vehicle pricing and information available for new and used cars, classic cars, motorcycles, boats, RVs and manufactured homes, offers in-depth shopping and research tools including a broad range of data, products and service and informational articles as well as tips and advice. NADAguides.com also produces electronic products, mobile applications, raw data, web services, web-syndicated products and print guidebooks. NADAguides.com is operated by NADAguides, a division of JD Power.

