2020 Q3 Marine Market Report
Industry Overview
Marine Market Update
We mentioned last quarter that “the Marine industry will be well-positioned to benefit from changes in recreational habits” assuming layoffs remained under control. Happily, that was indeed the case, and values for all segments of boats and watercraft are substantially higher than last year.
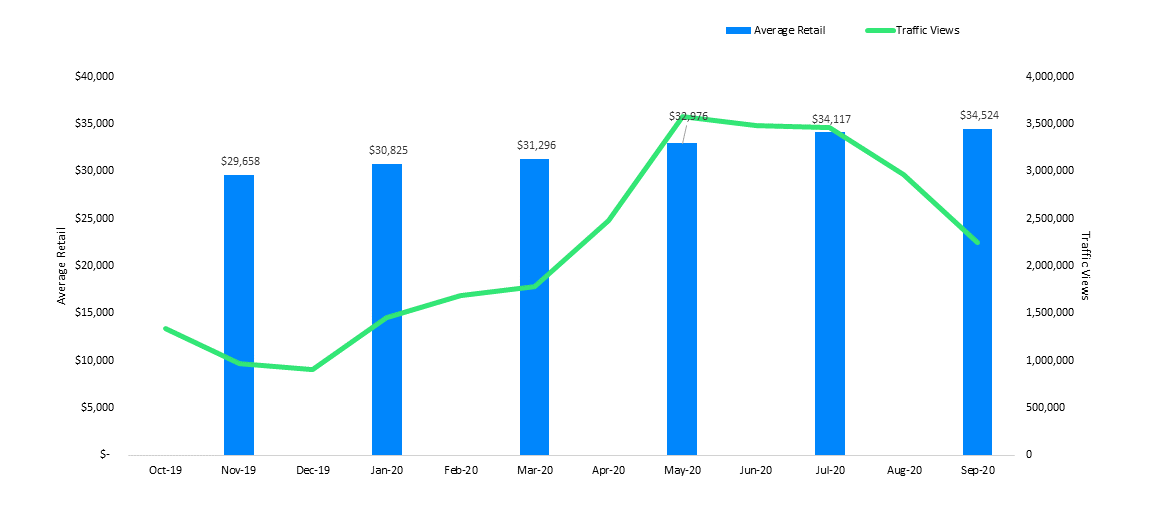
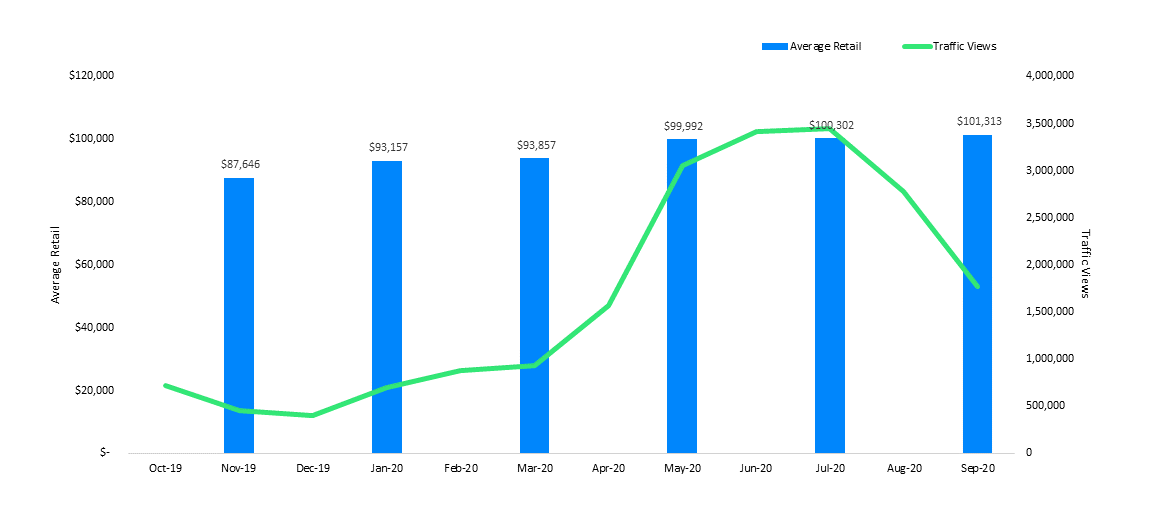
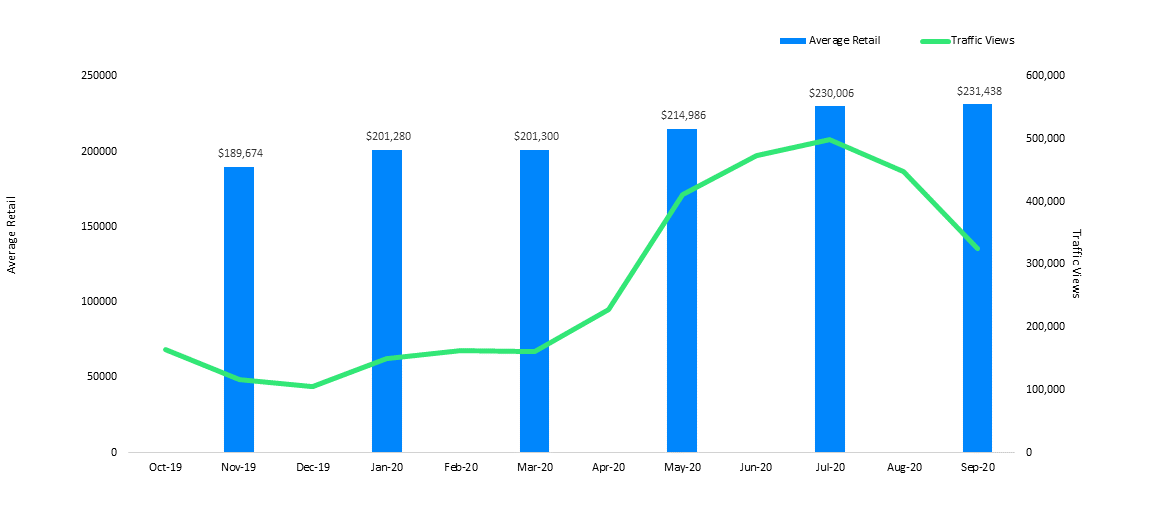
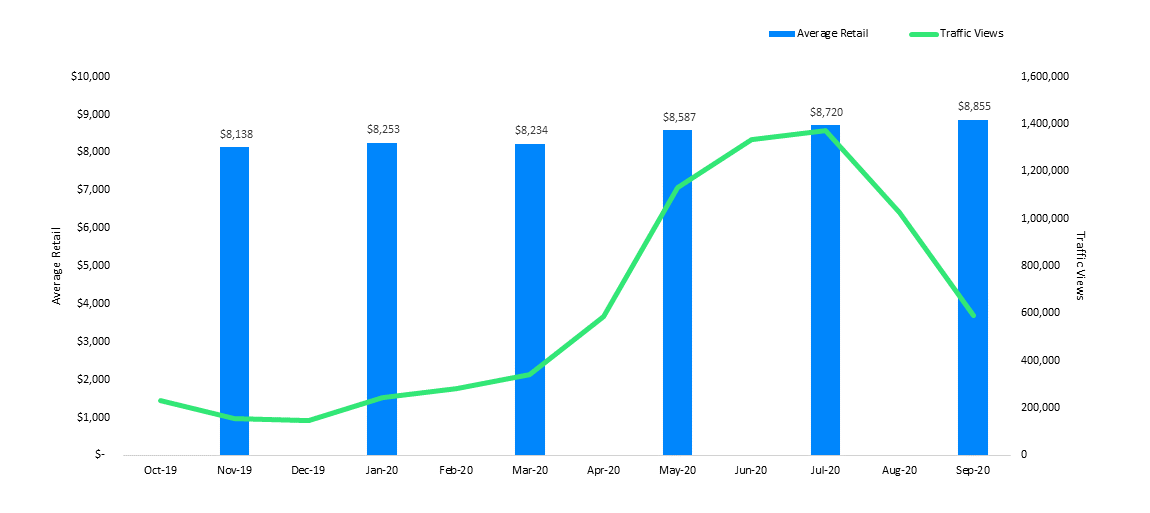
Looking at individual segments, inboards continue to impress, bringing a whopping 21.7% more value than this time last year. Stern drives also performed well, showing no seasonal decline heading into the Fall, with values 10.4% higher year-over-year. Outboards followed a similar pattern and are running 8.6% ahead of 2019. The personal watercraft segment was very healthy, with values increasing going into the fall and running 7.6% higher than last year.
The marine industry continues to benefit from customers shifting their discretionary income from vacations to other forms of entertainment. Getting out on the water with selected friends and family will continue to be a low-risk, high-fun way to spend leisure time.
Power Boat Values
Average Retail Value by Category - Values for the Last 10 Model Years
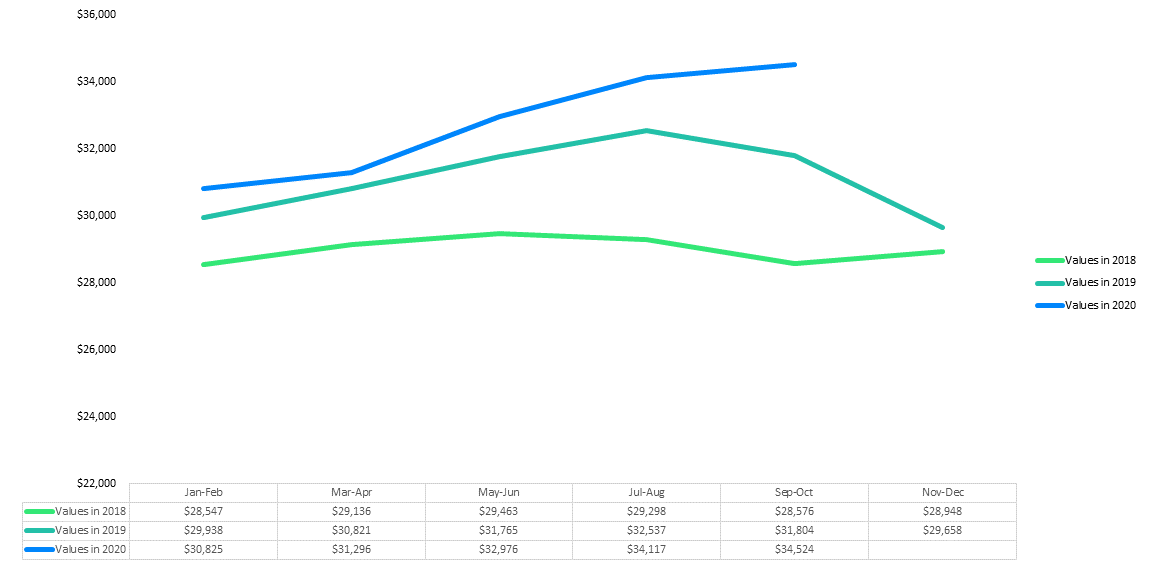
Outboard Boats
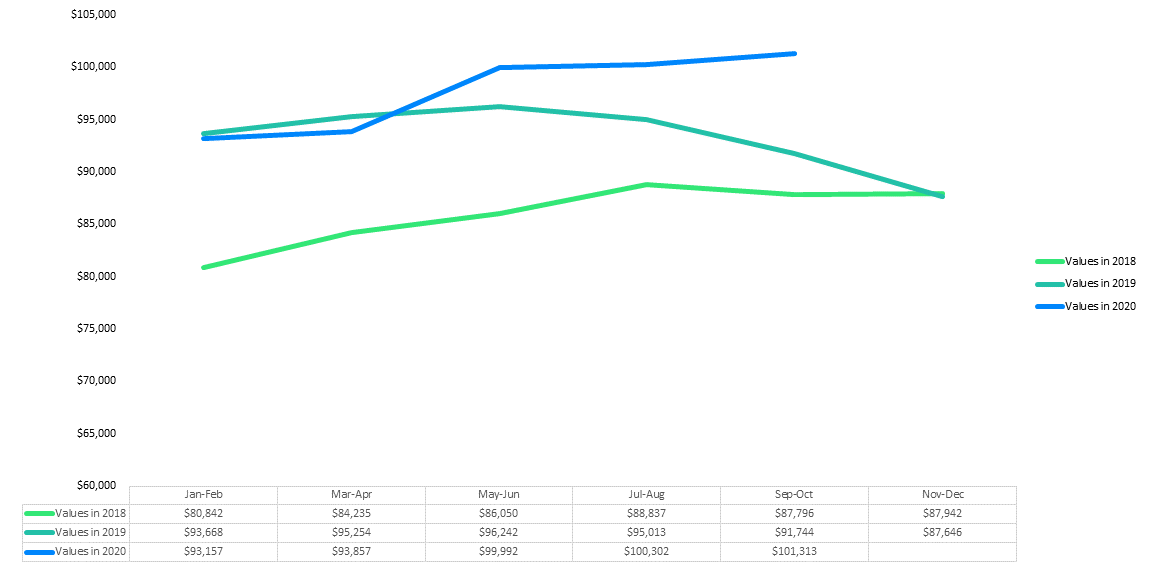
Stern Drive Boats
Marine Values
Average Retail Value by Category - Values for the Last 10 Model Years
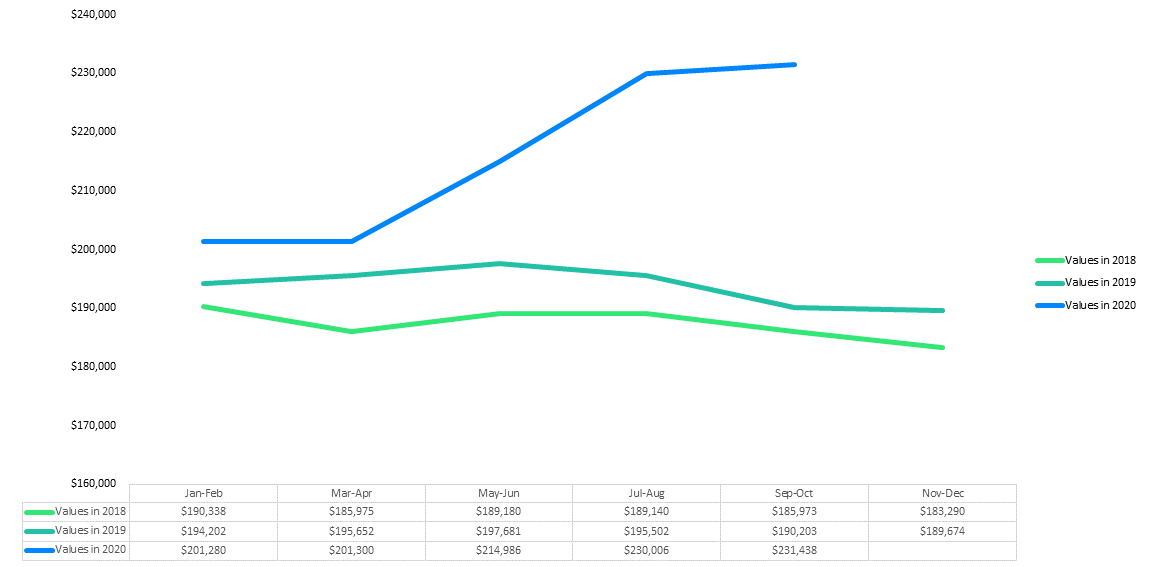
Inboard Boats
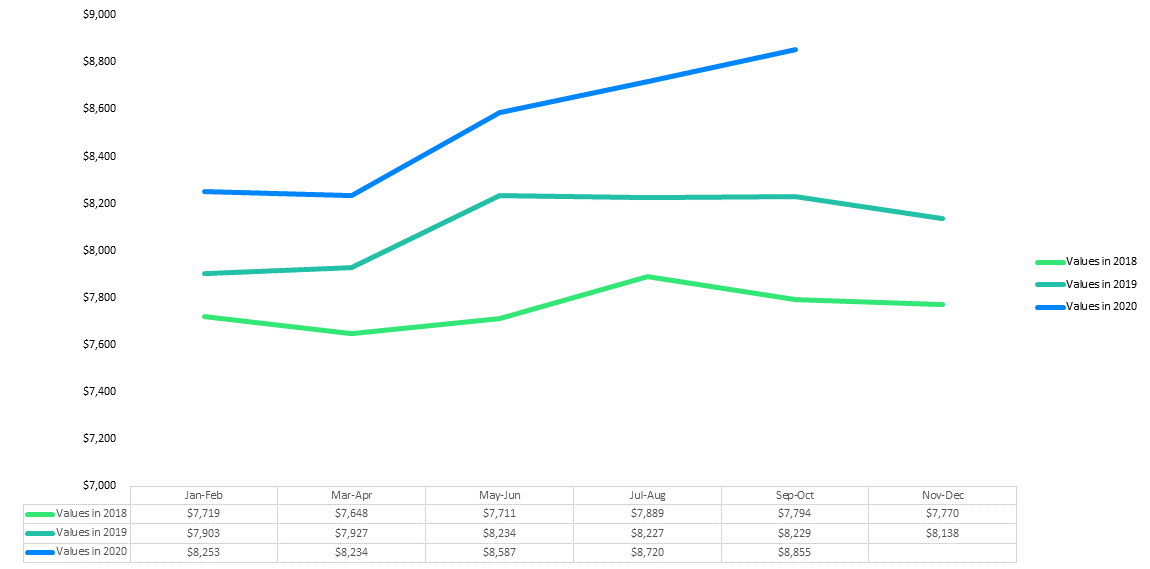
Personal Watercraft
Power Boat Values vs. Traffic
Average Retail Value and Traffic Views by Category
Outboard Boats
Stern Drive Boats
Marine Values vs. Traffic
Average Retail Value and Traffic Views by Category
Inboard Boats
Personal Watercraft
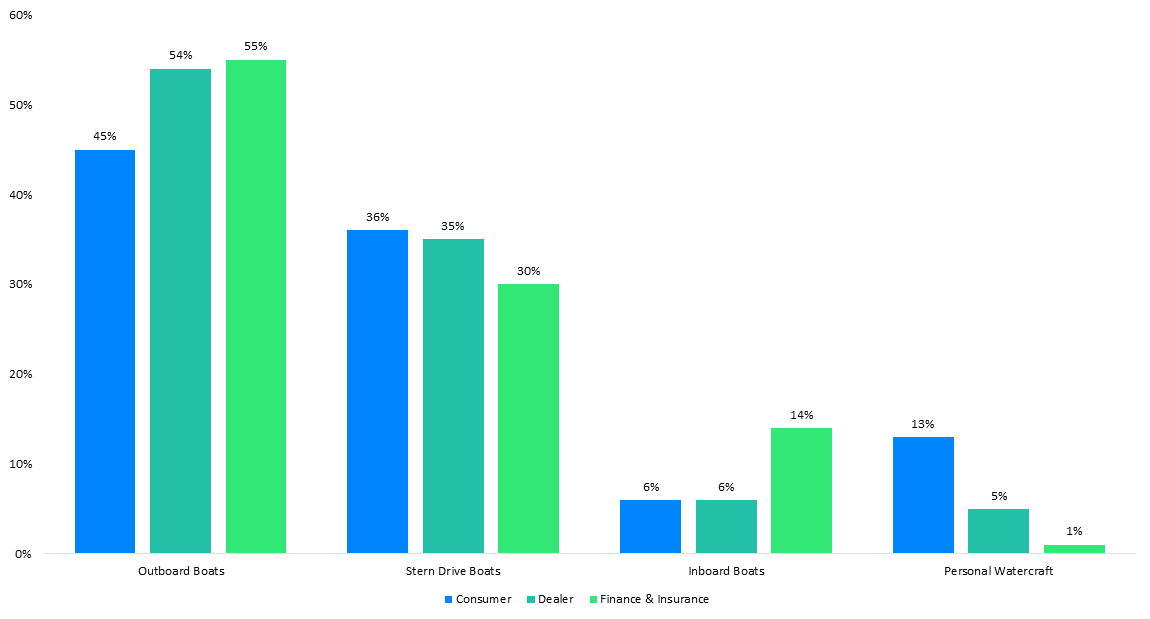
Marine Categories
Category Views Among Consumers, Dealers, and Finance & Insurance Institutions in 2020 Q1-Q3
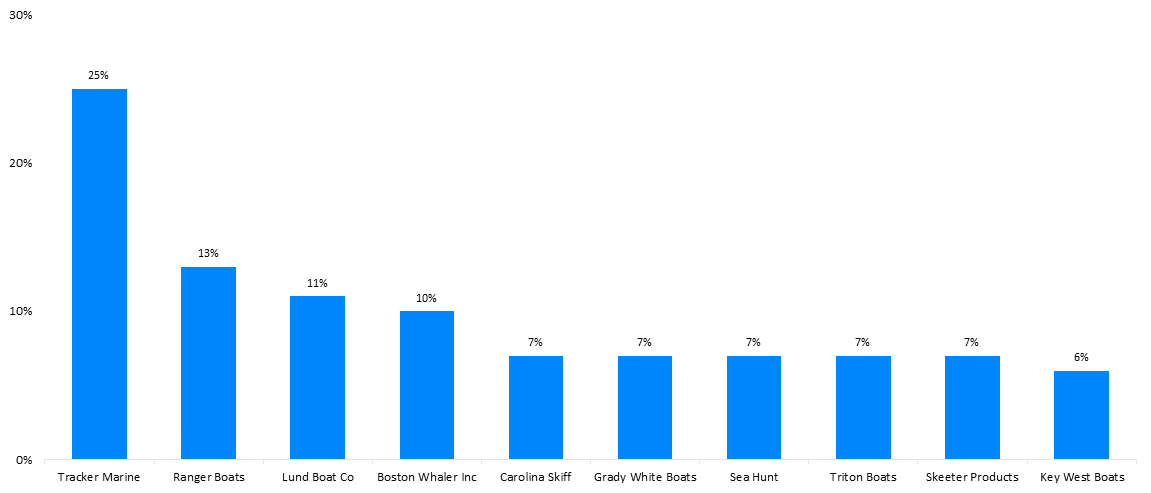
Power Boat Brands
Top Researched Brands in 2020 Q1-Q3
Outboard Brands
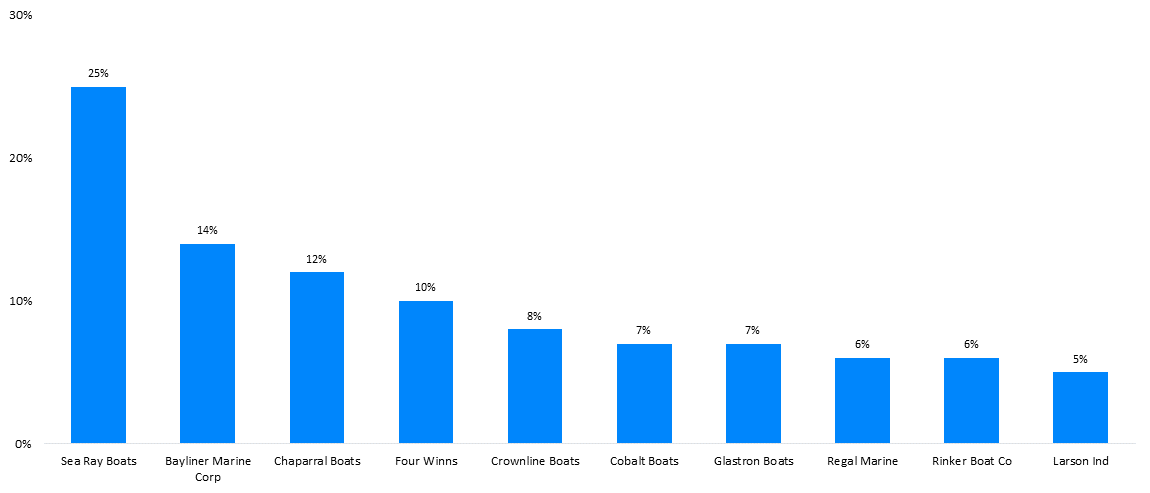
Stern Drive Brands
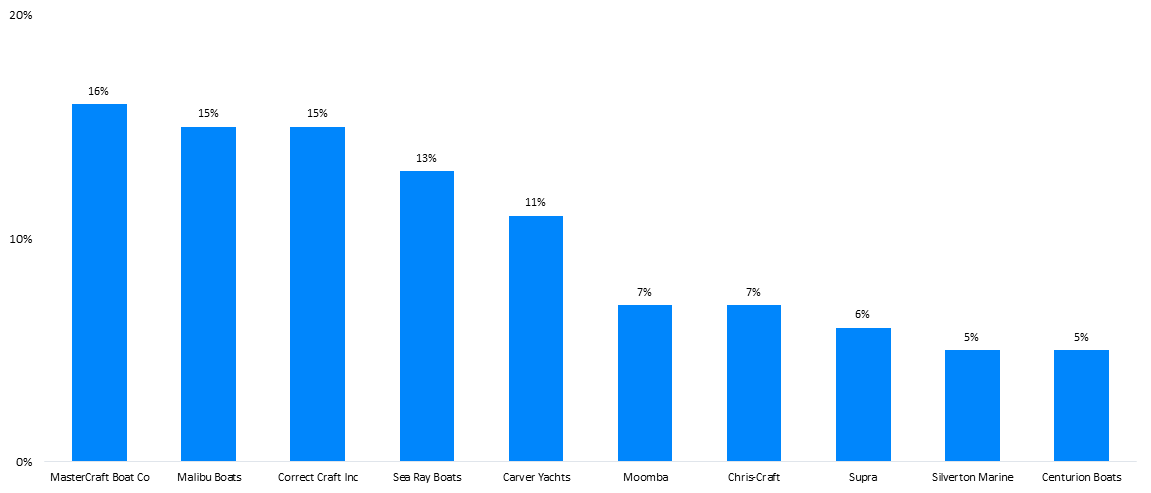
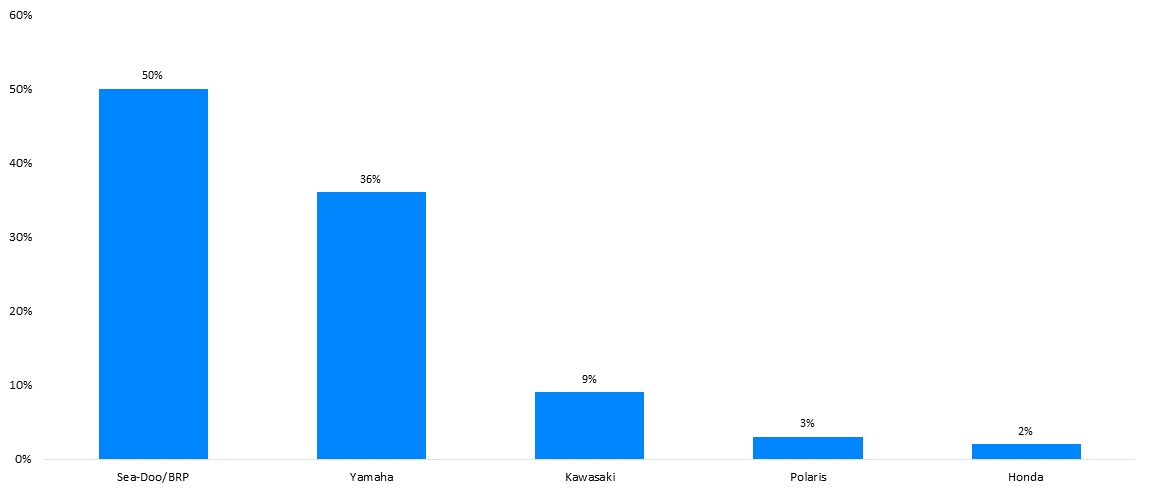
Marine Brands
Top Researched Brands in 2020 Q1-Q3
Inboard Brands
Personal Watercraft Brands
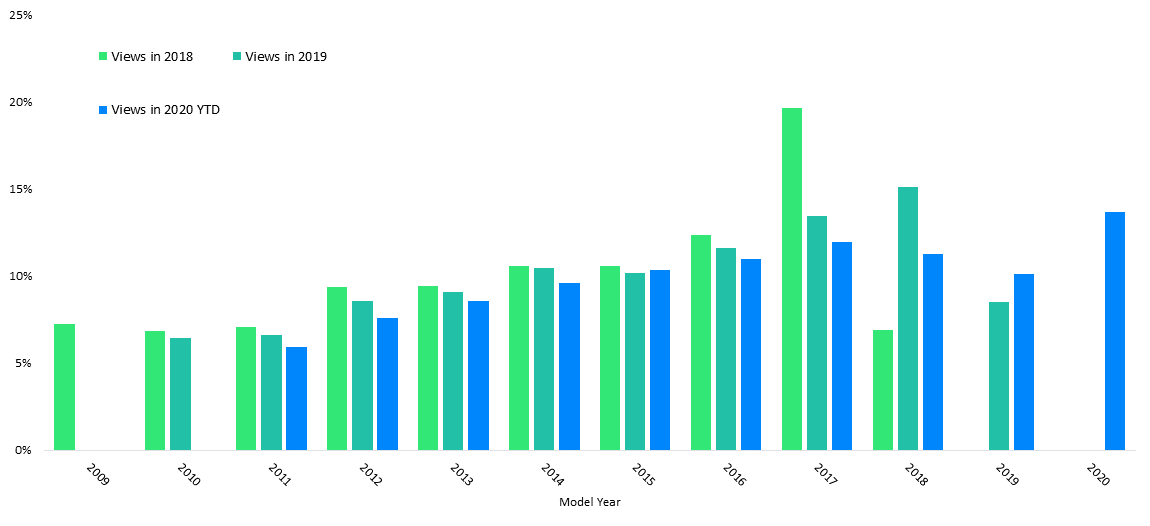
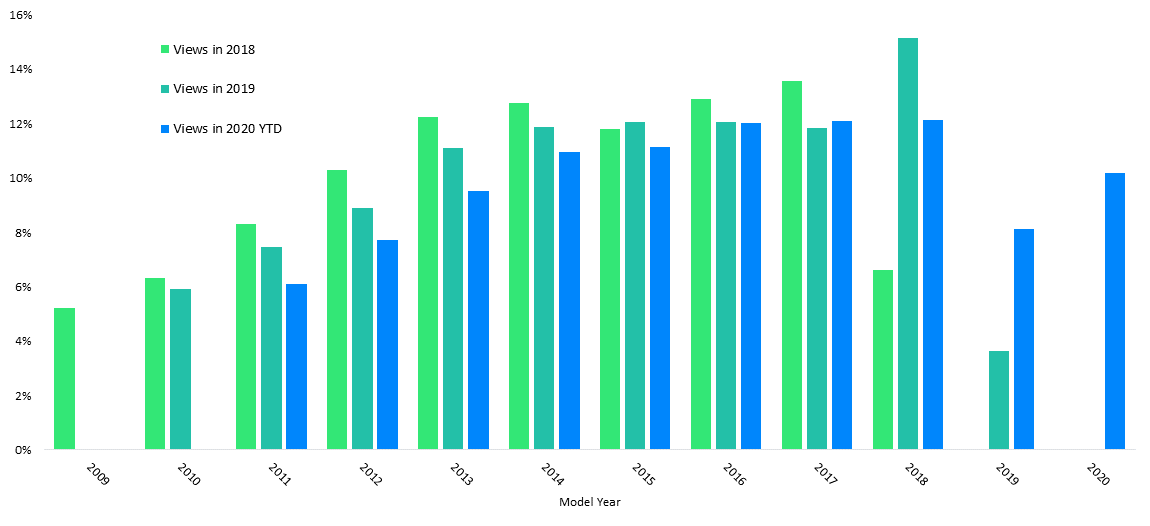
Model Years
Top Researched Model Years by Category
Outboard Boats
Pontoon Boats
Web Traffic by State
Traffic by State in 2020 Q1-Q3
Outboard Boats
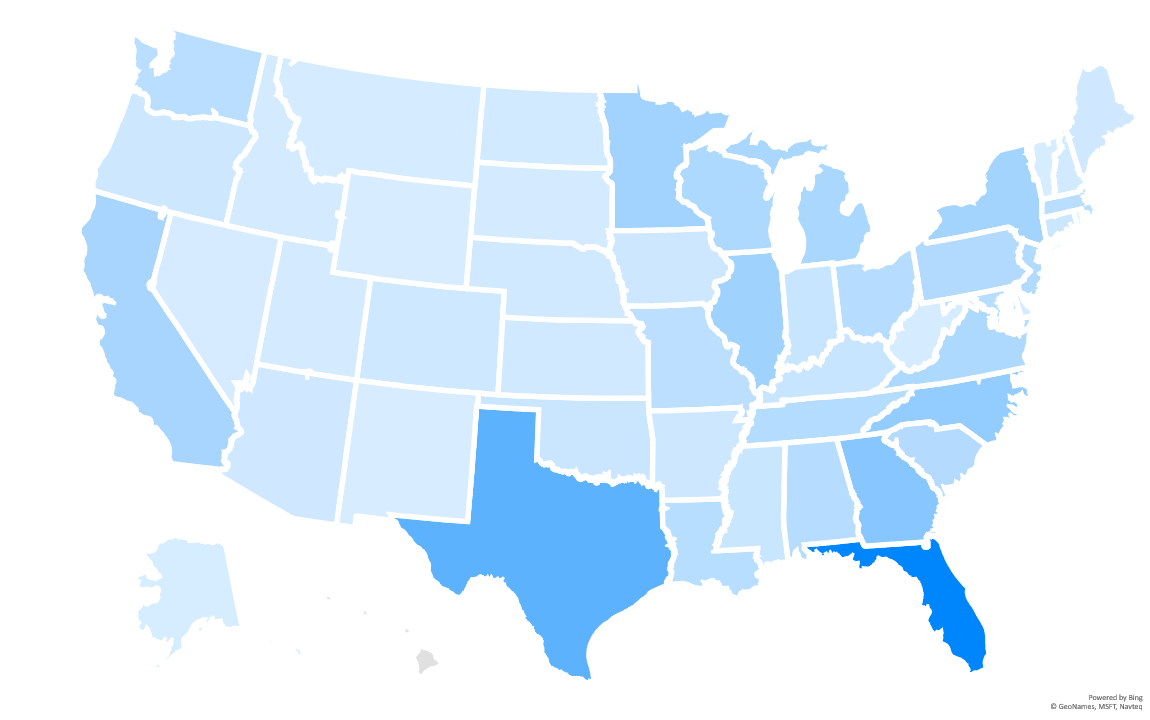
| > 500,000 | |
| 250,000 - 500,000 | |
| 100,000 - 249,999 | |
| < 100,000 |
Pontoon Boats
| > 50,000 | |
| 35,000 - 50,000 | |
| 19,000 - 34,999 | |
| < 19,000 |
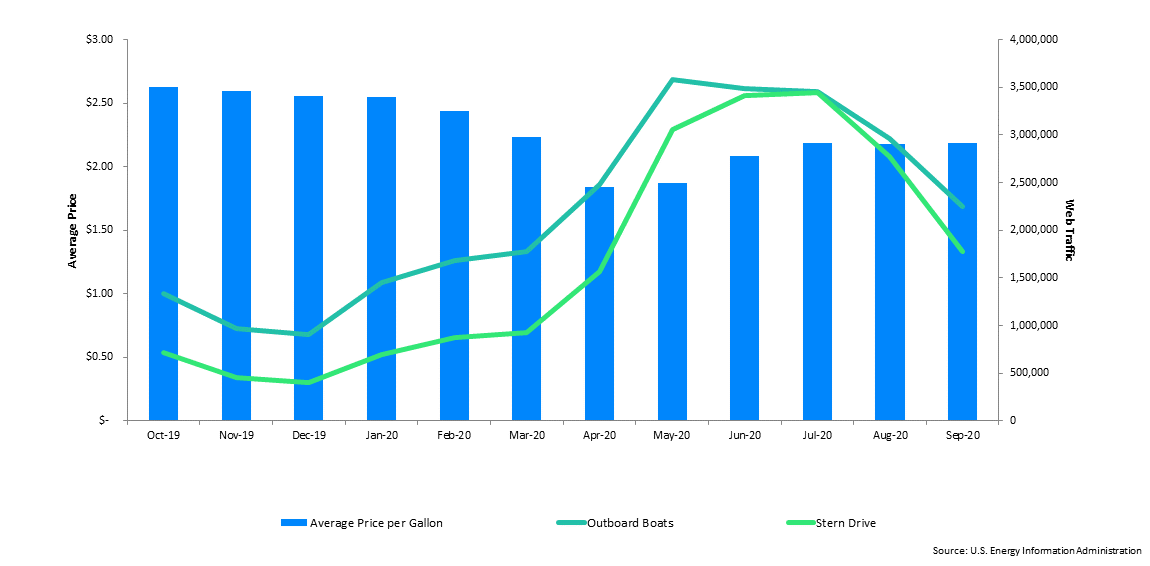
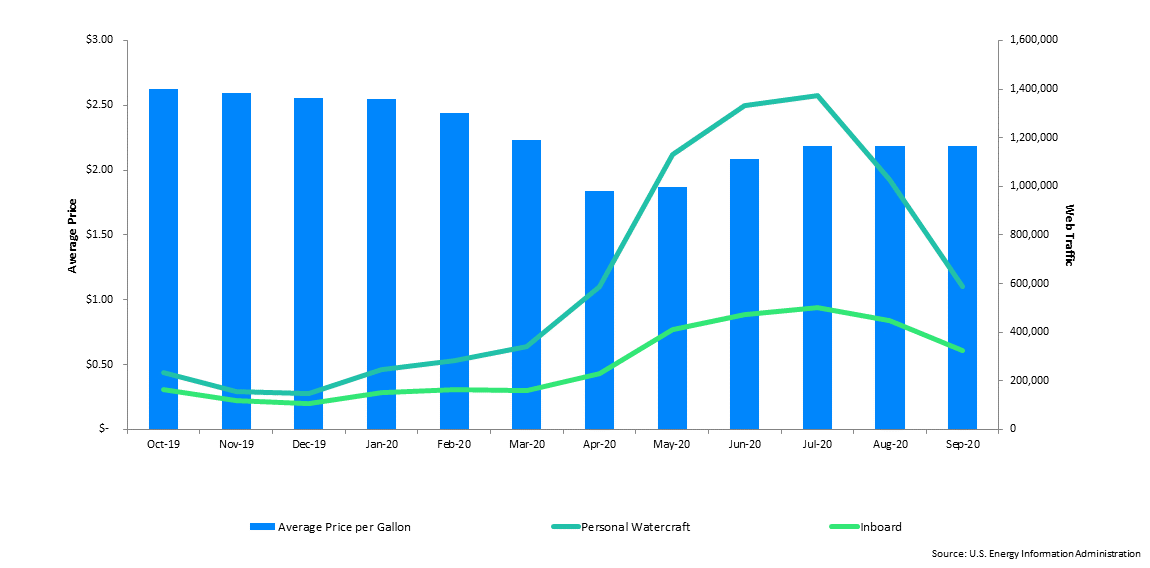
Fuel Price Data
Regular Grade Gasoline Prices vs. Consumer Traffic by Category
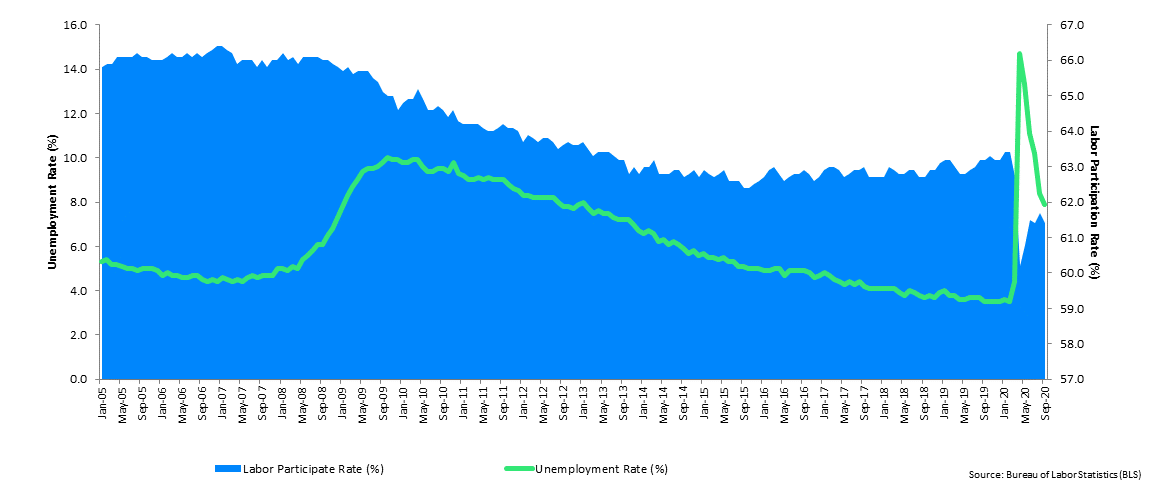
Economic Data
Unemployment & Labor Participation Rate (Seasonally Adjusted)
JD Power / NADAguides
Disclaimer
NADAguides, a division of JD Power, makes no representations about future performance or results based on the data and the contents available in this report (“Market Insights”). Market Insights is provided for informational purposes only and is provided AS IS without warranty or guarantee of any kind. By accessing Market Insights via email or the NADAguides website, you agree not to reprint, reproduce, or distribute Market Insights without the express written permission of NADAguides.
About NADAguides.com
NADAguides.com, the largest publisher of the most market-reflective vehicle pricing and information available for new and used cars, classic cars, motorcycles, boats, RVs and manufactured homes, offers in-depth shopping and research tools including a broad range of data, products and service and informational articles as well as tips and advice. NADAguides.com also produces electronic products, mobile applications, raw data, web services, web-syndicated products and print guidebooks. NADAguides.com is operated by NADAguides, a division of JD Power.

