2020 Q3 Powersports Market Report
Industry Overview
Powersports Market Update
Values in 2020 continue to crush the previous two years. Interest in all segments of the powersports industry is hot, as new enthusiasts enter the market and existing riders look for new bikes and side-by-sides.
In the motorcycle segment, cruiser values increased steeply once warmer months hit, and are now running 5.2% ahead of last year. Sportbikes also saw a healthy rebound in the summer months, currently bringing 8.3% more year-over-year.
Side-by-sides were strong in the most recent period, with the utility segment valued a whopping 16.2% higher than the same period of 2019, and the sport segment higher by an impressive 10.5%.
The powersport industry continues to benefit from customers shifting their discretionary income from vacations to other forms of entertainment. Getting out on the trails and roads solo or with a few other folks will continue to be a low-risk, high-fun adventure.
Powersport Values
Average Retail Value by Category - Values for the Last 10 Model Years
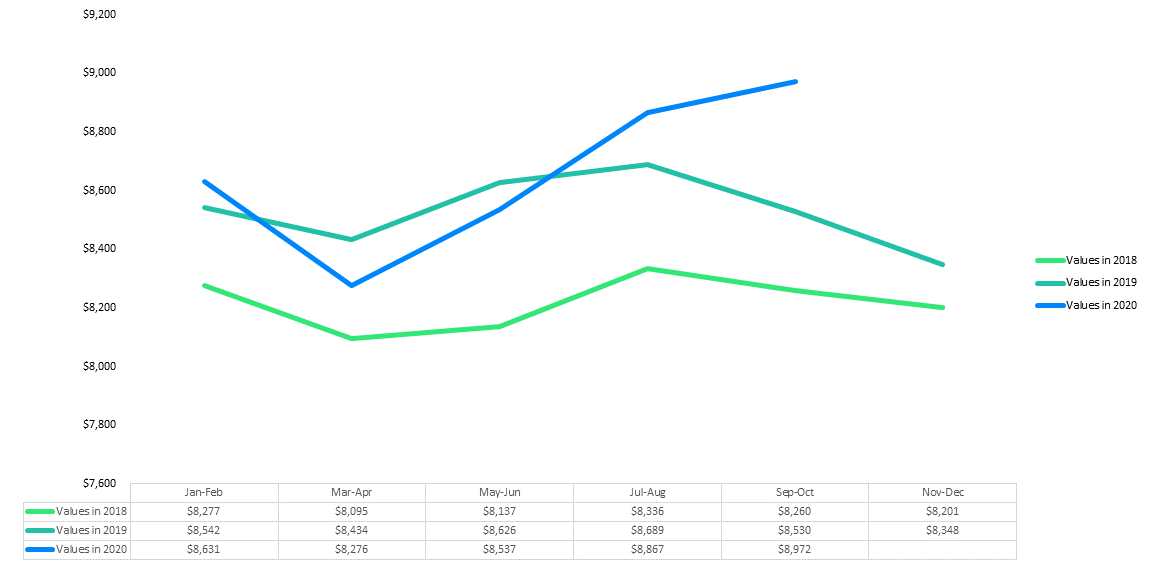
Cruisers
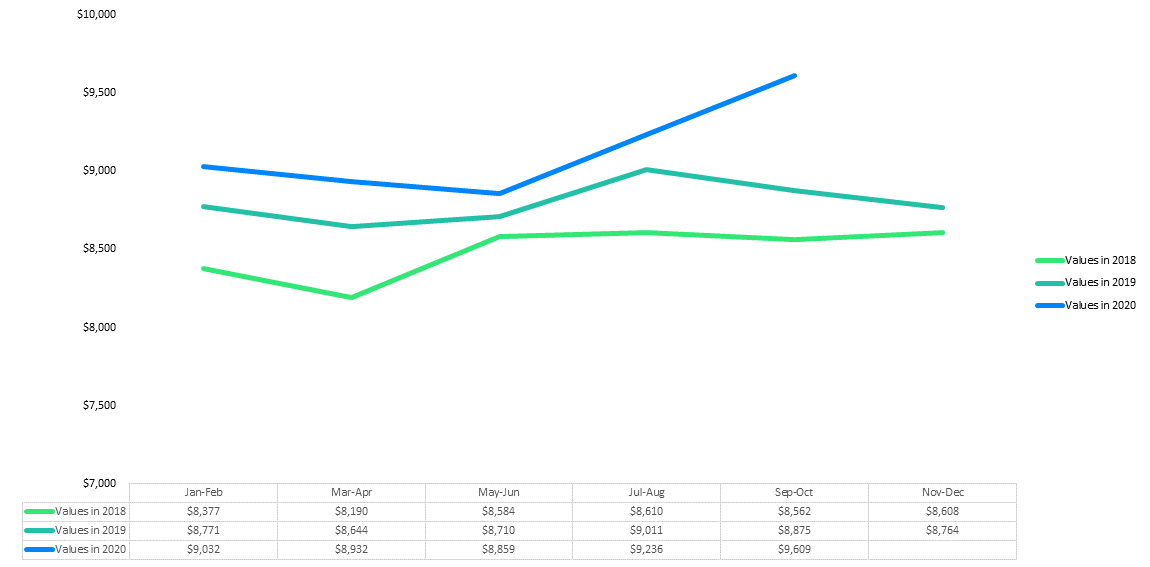
Sportbikes
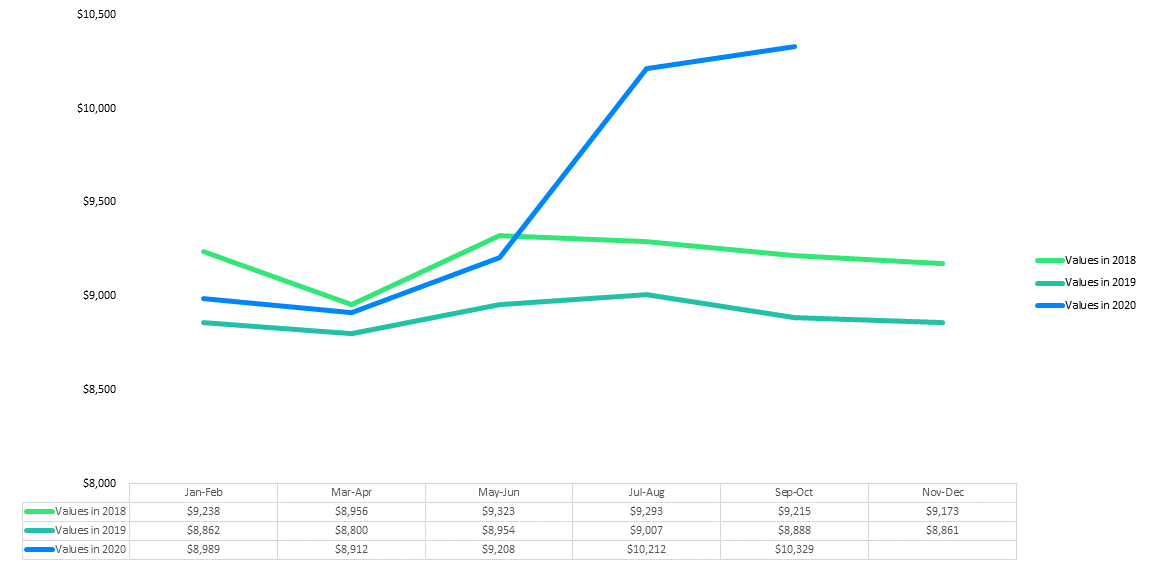
Utility Side By Sides
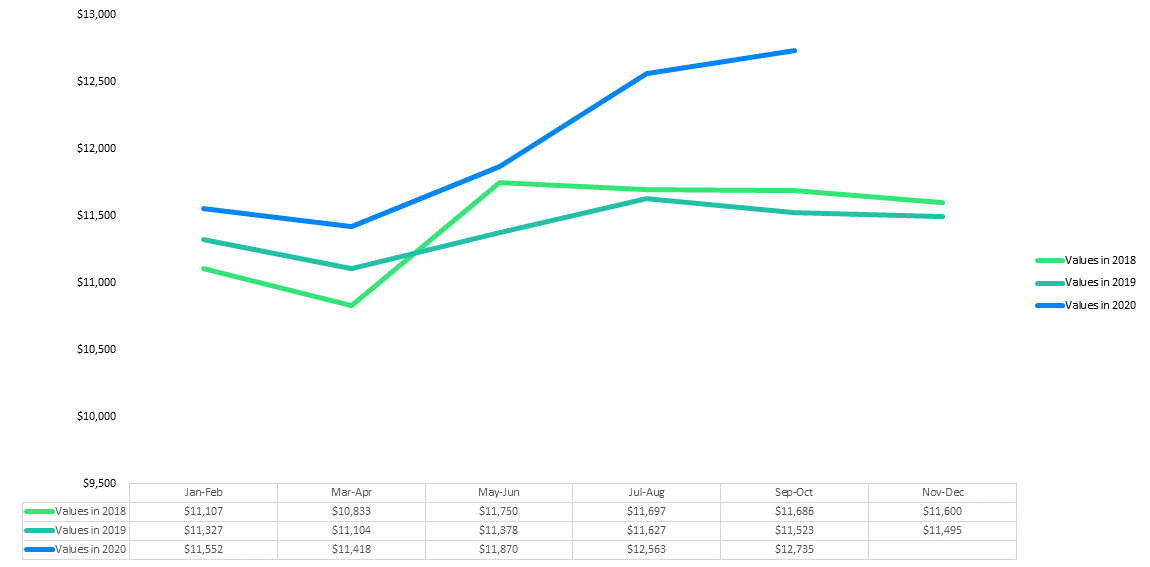
Sport Side By Sides
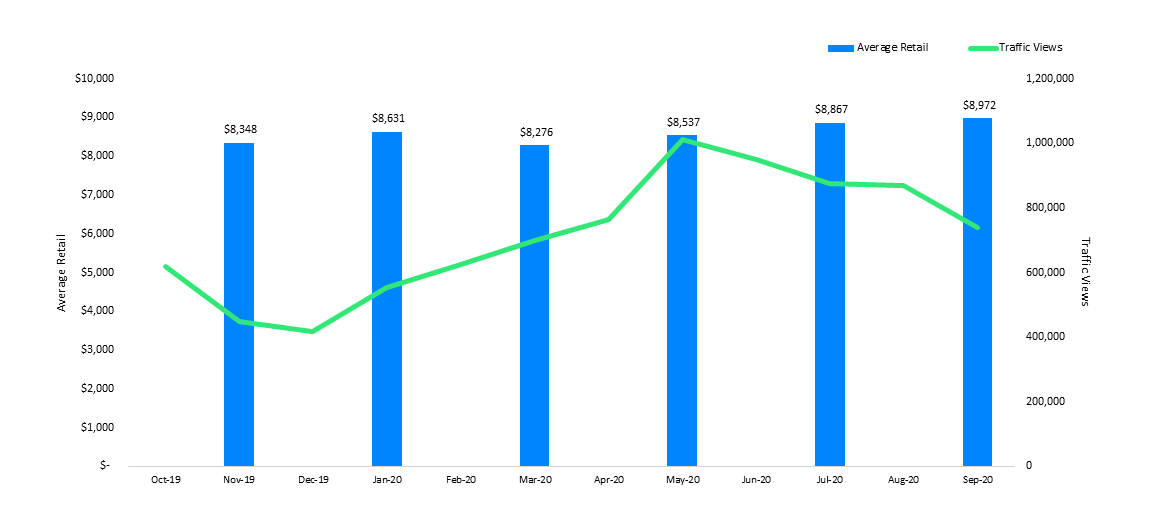
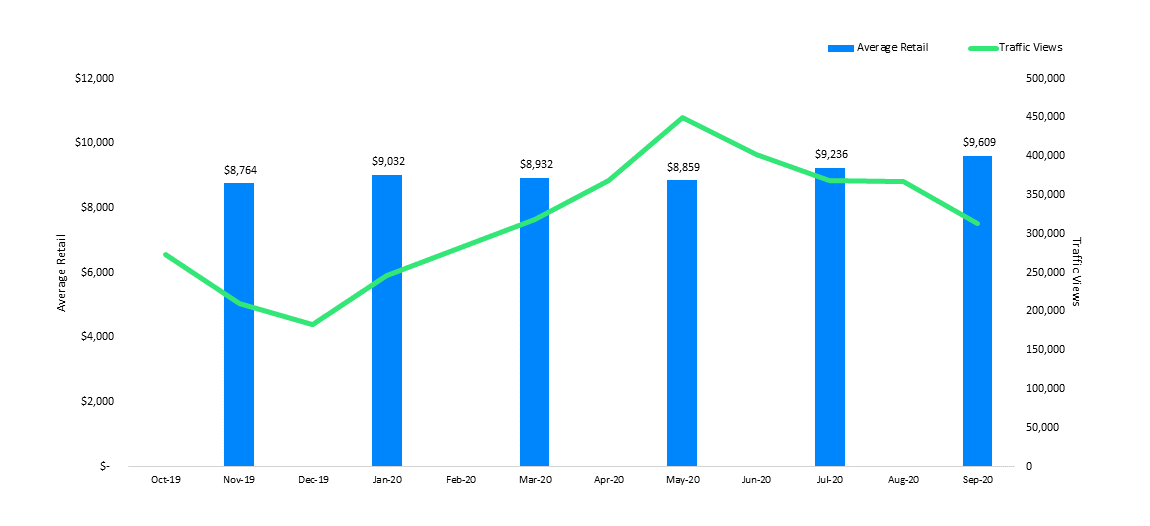
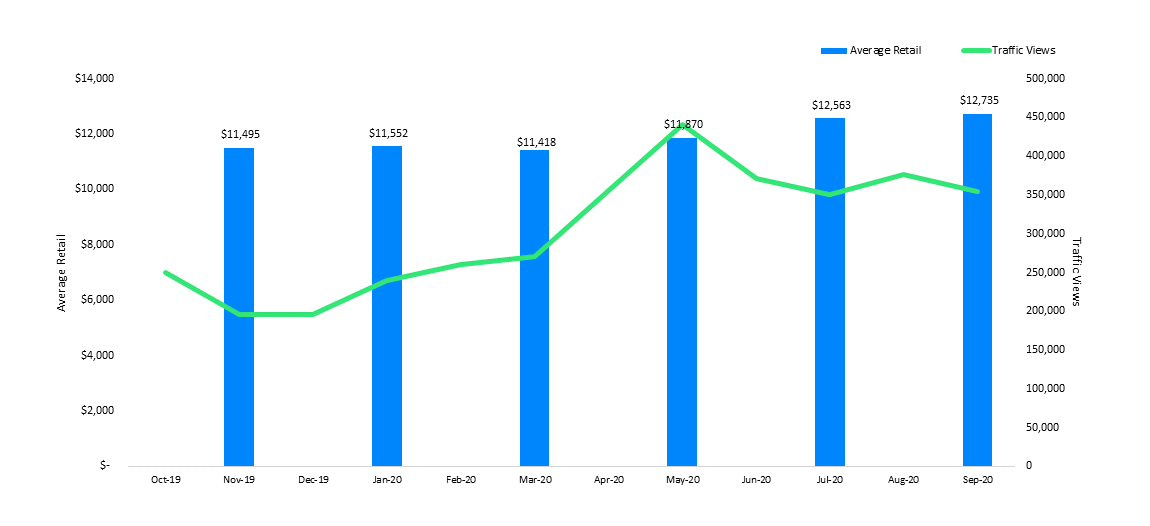
Powersport Values vs. Traffic
Average Retail Value and Traffic Views by Category
Cruisers
Sportbikes
Utility Side By Sides

Sport Side By Sides
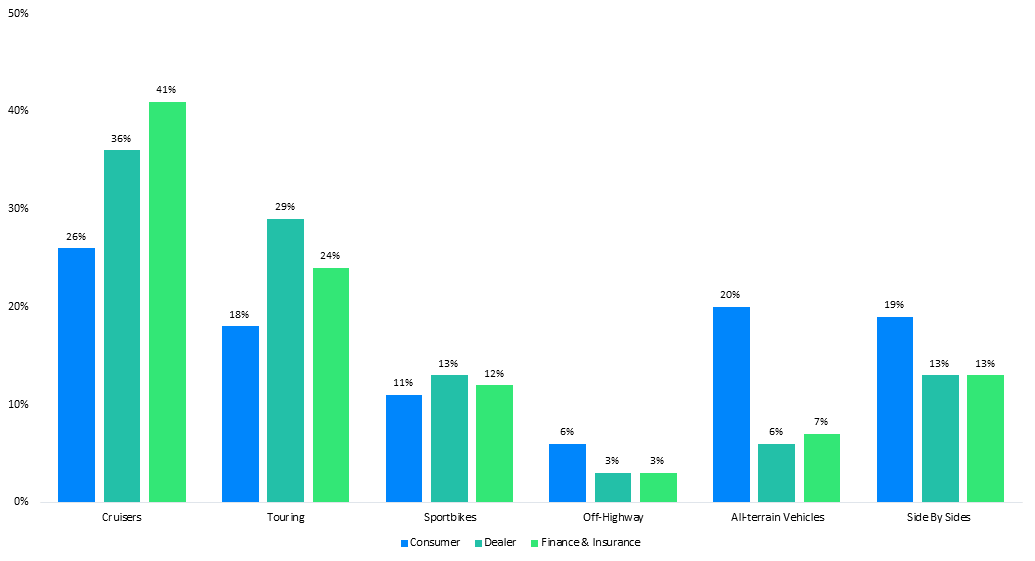
Powersport Categories
Category Views Among Consumers, Dealers, and Finance & Insurance Institutions in 2020 Q1-Q3
Motorcycle Brands
Top Researched Brands in 2020 Q1-Q3
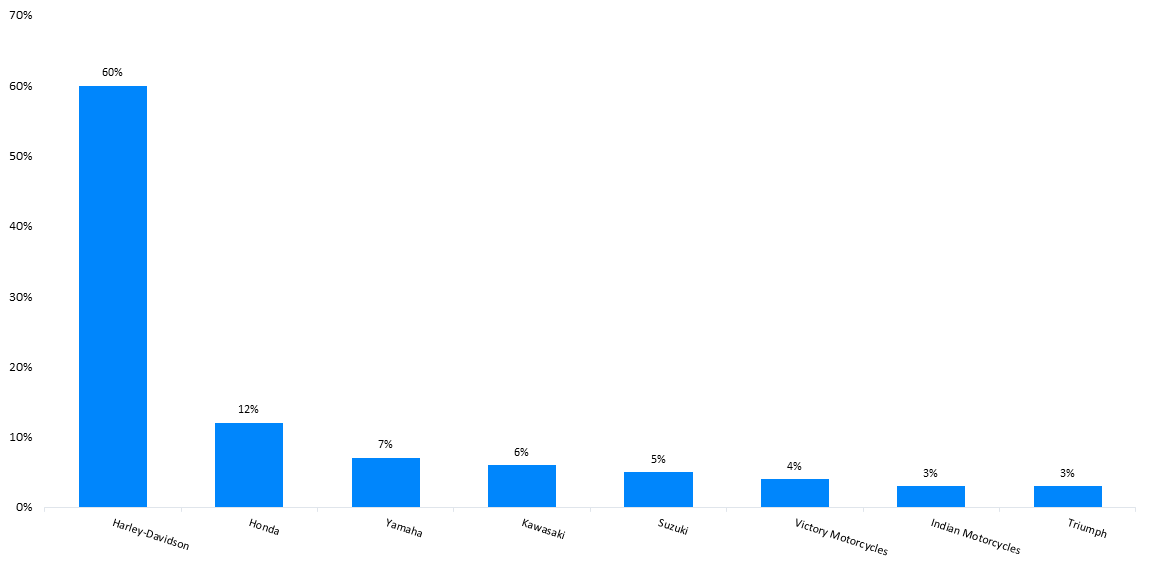
Cruiser Brands
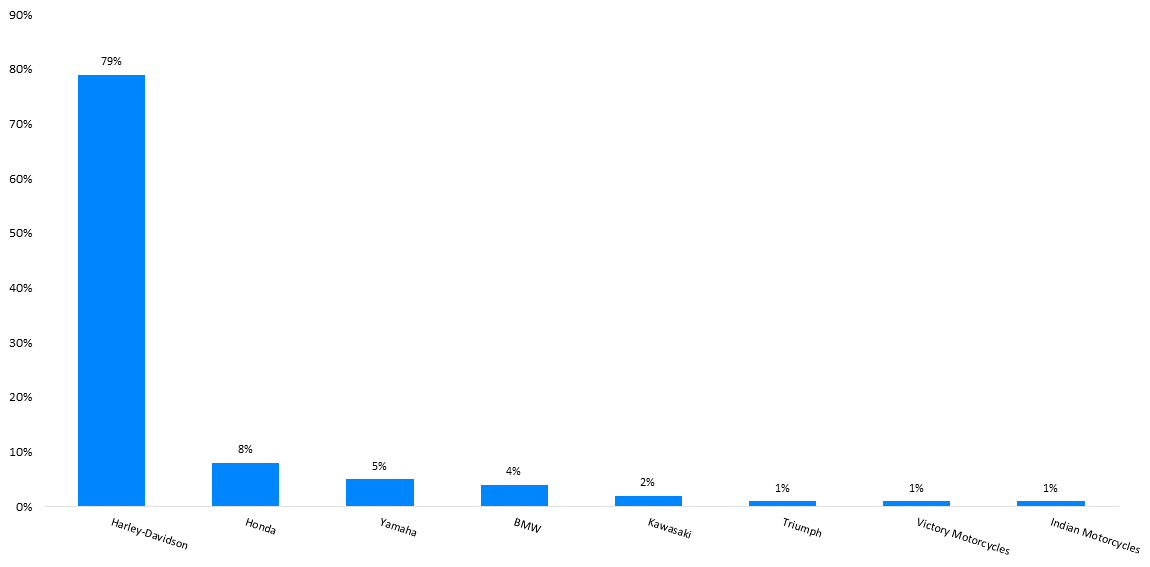
Touring Brands
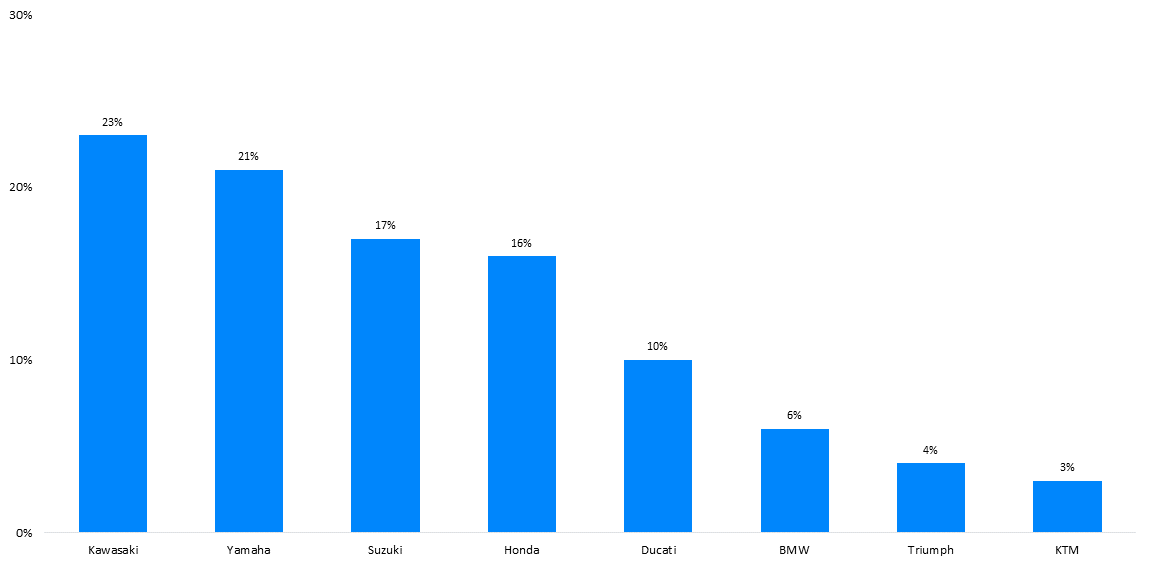
Sportbike Brands
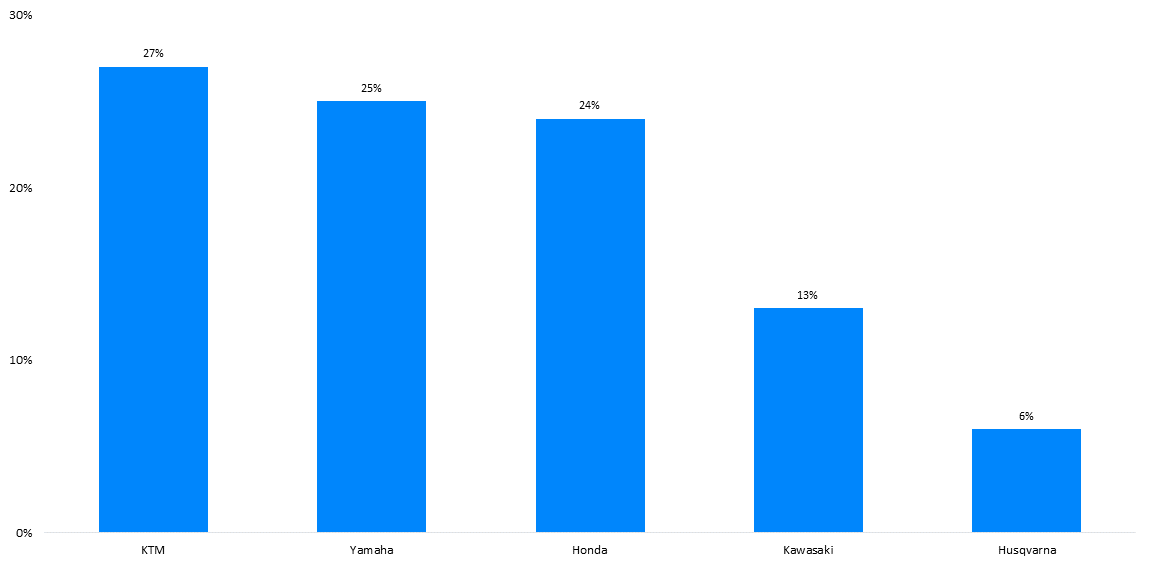
Off-Highway Brands
Off-Road Vehicle Brands
Top Researched Brands in 2020 Q1-Q3
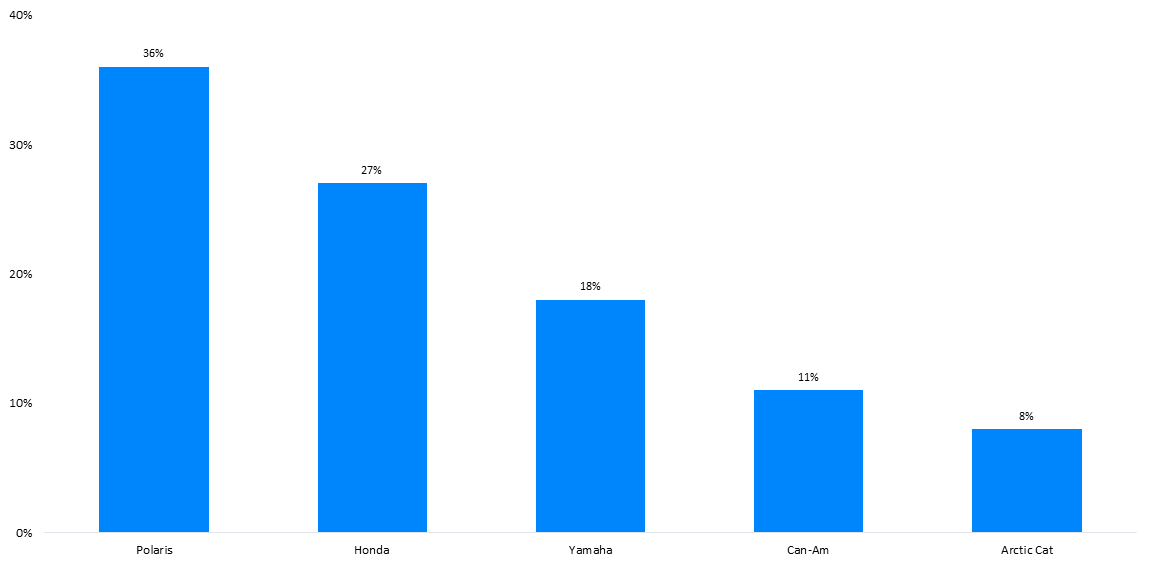
All-terrain Vehicle Brands
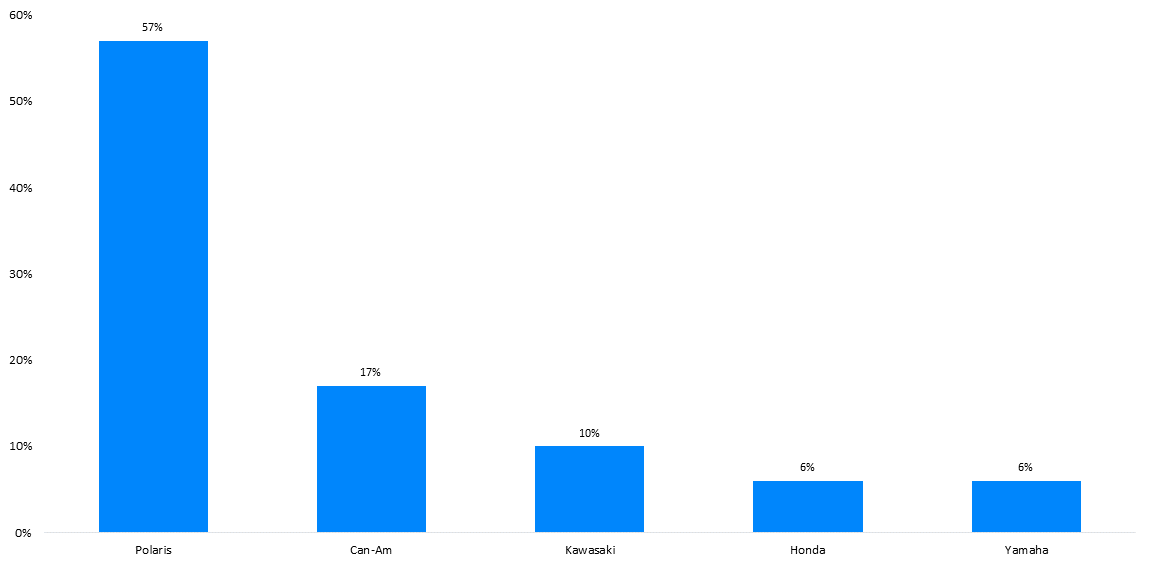
Side By Side Brands
Model Years
Top Researched Model Years by Category
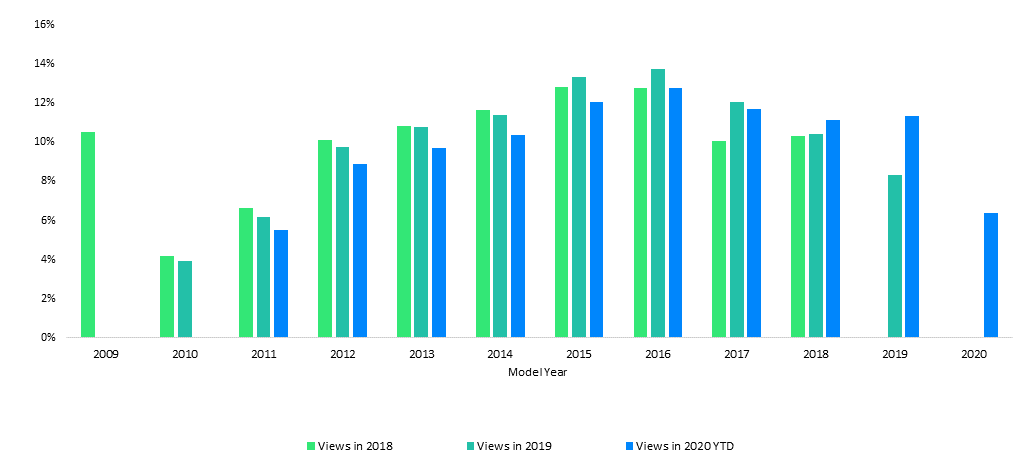
Sportbikes
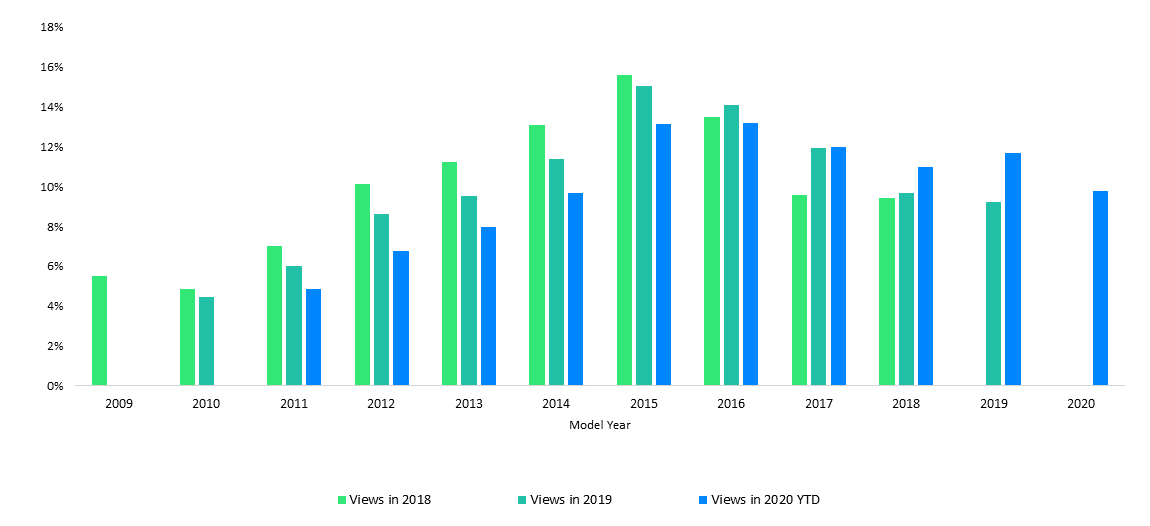
Utility Side By Sides
Web Traffic by State
Traffic by State in 2020 Q1-Q3
Motorcycles
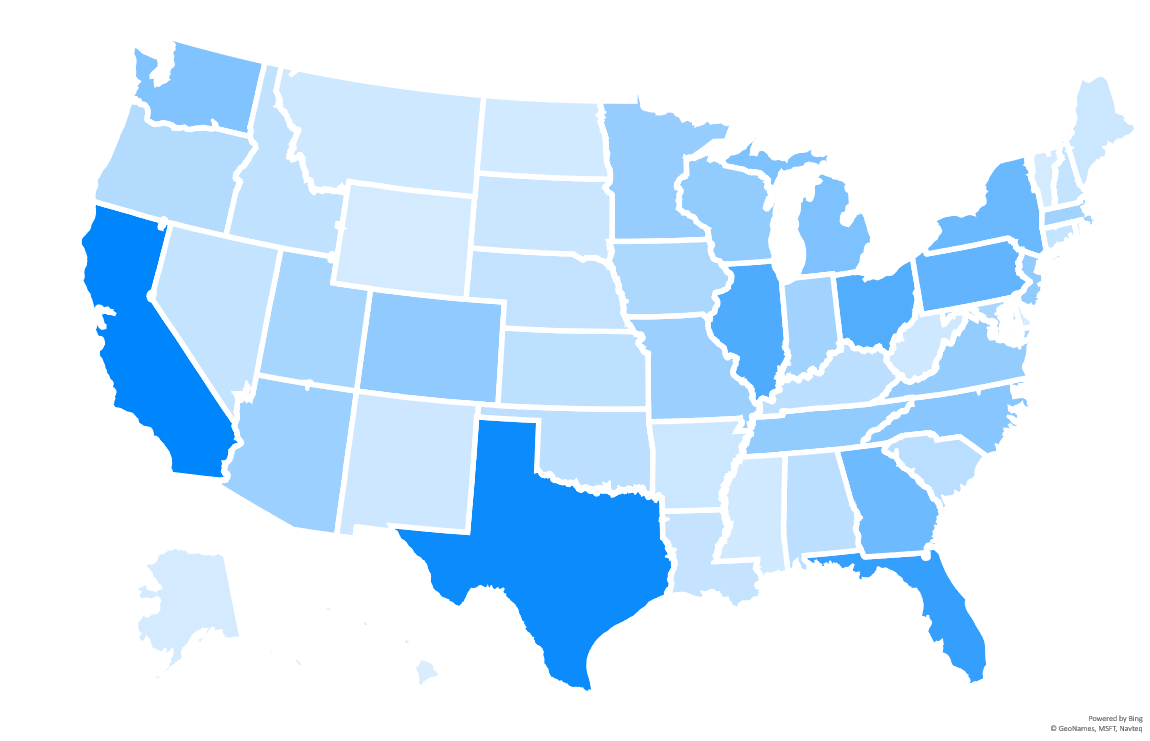
| > 130,000 | |
| 90,000 - 130,000 | |
| 45,000 - 89,999 | |
| < 45,000 |
Side By Sides
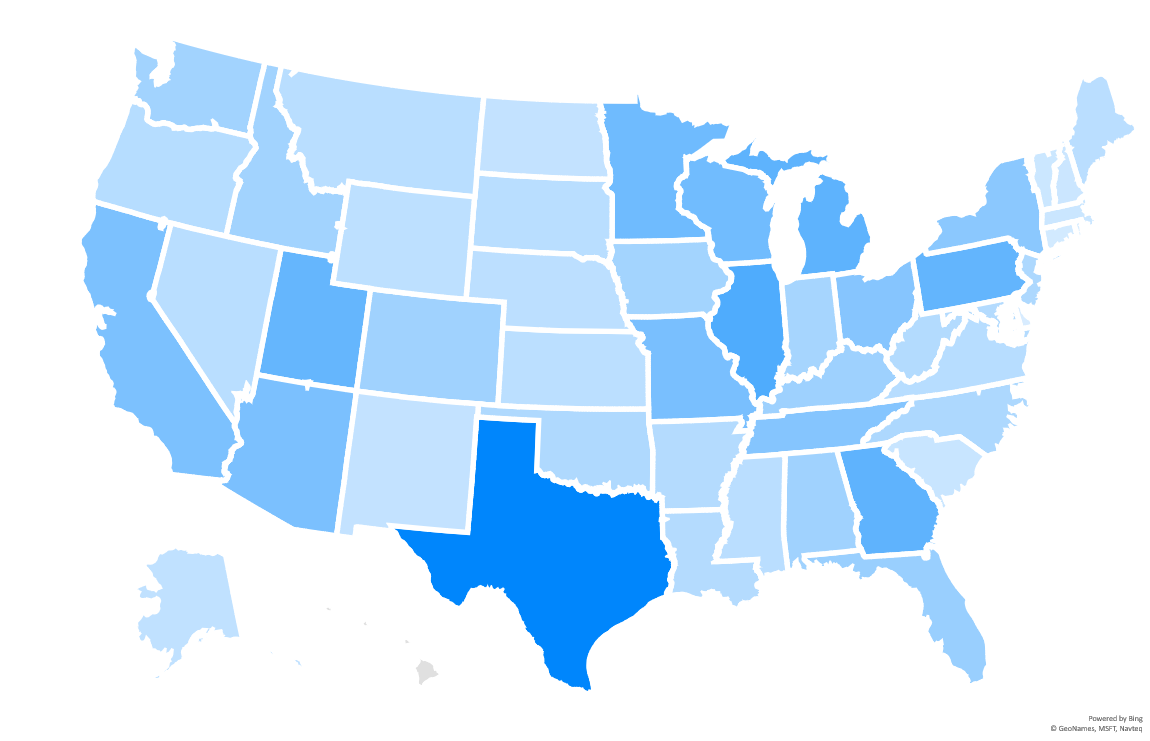
| > 30,000 | |
| 20,000 - 30,000 | |
| 9,000 - 19,999 | |
| < 9,000 |
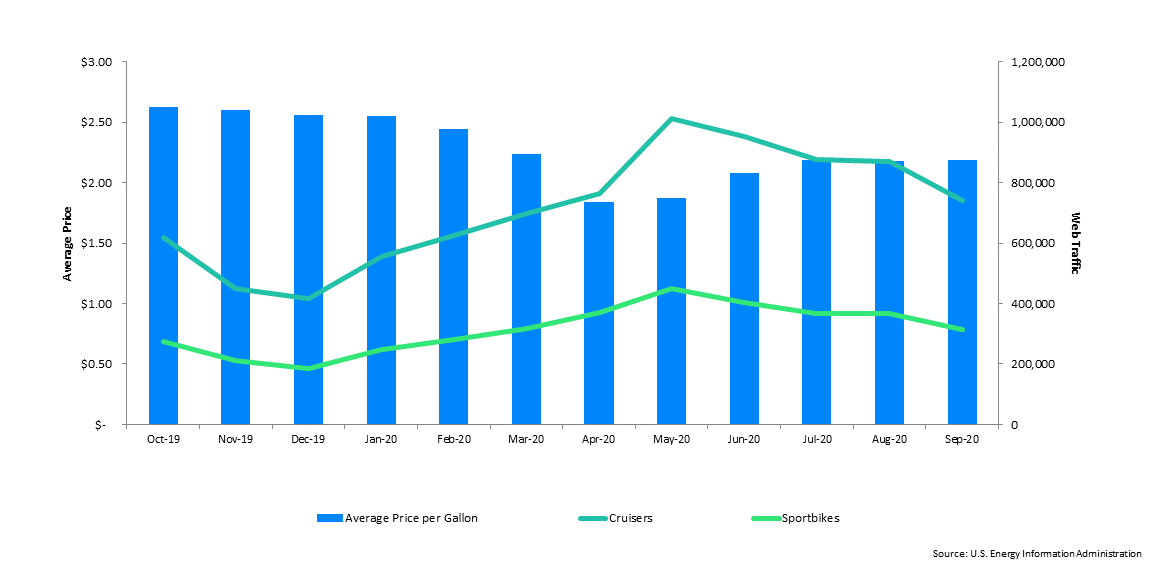
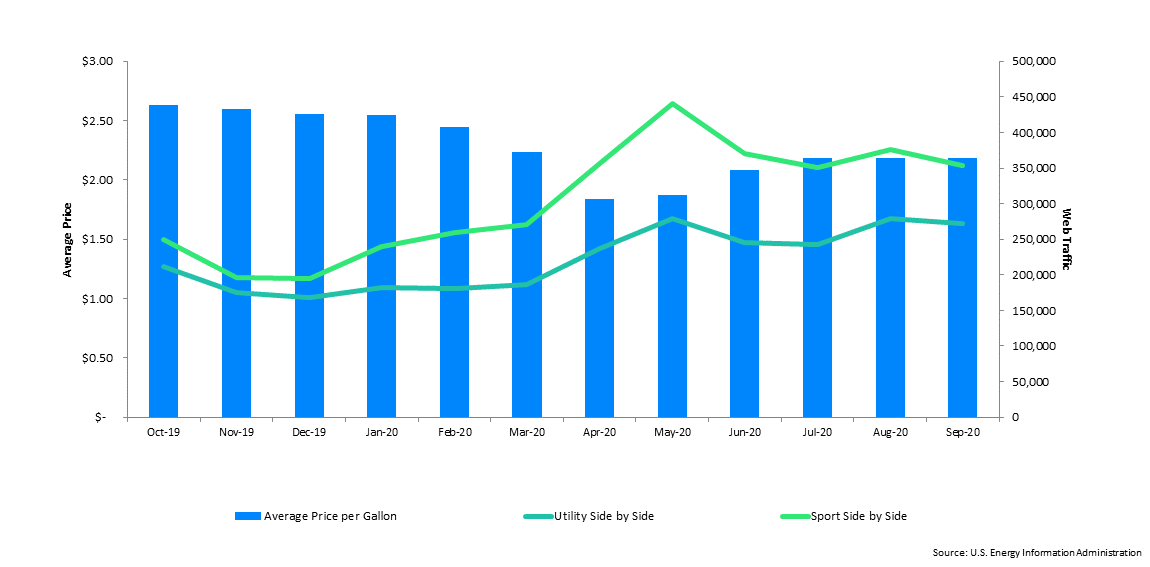
Fuel Price Data
Regular Grade Gasoline Prices vs. Consumer Traffic by Category
Motorcycles
Side By Sides
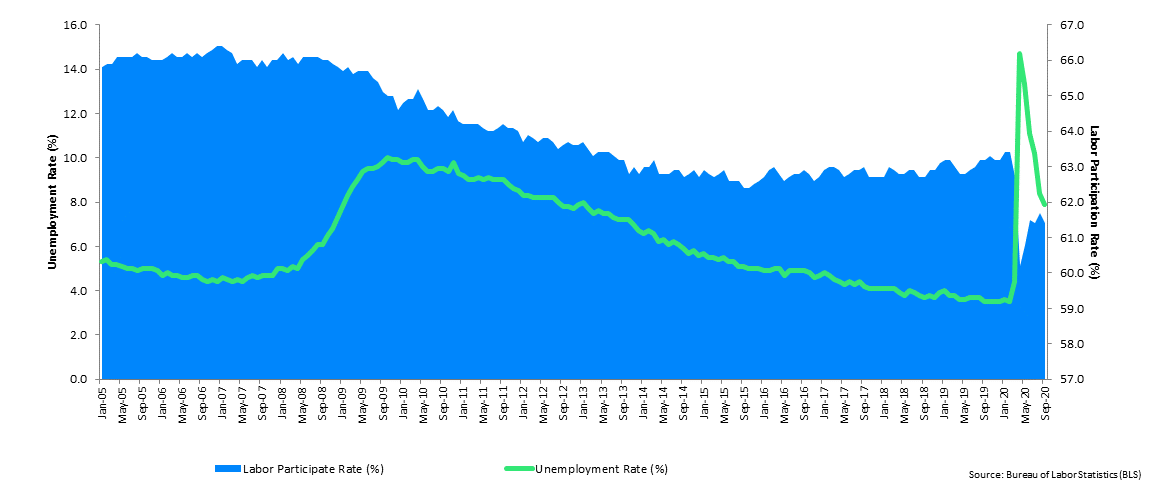
Economic Data
Unemployment & Labor Participation Rate (Seasonally Adjusted)
JD Power / NADAguides
Disclaimer
NADAguides, a division of JD Power, makes no representations about future performance or results based on the data and the contents available in this report (“Market Insights”). Market Insights is provided for informational purposes only and is provided AS IS without warranty or guarantee of any kind. By accessing Market Insights via email or the NADAguides website, you agree not to reprint, reproduce, or distribute Market Insights without the express written permission of NADAguides.
About NADAguides.com
NADAguides.com, the largest publisher of the most market-reflective vehicle pricing and information available for new and used cars, classic cars, motorcycles, boats, RVs and manufactured homes, offers in-depth shopping and research tools including a broad range of data, products and service and informational articles as well as tips and advice. NADAguides.com also produces electronic products, mobile applications, raw data, web services, web-syndicated products and print guidebooks. NADAguides.com is operated by NADAguides, a division of JD Power.
JD Power / NADAguides
(800) 966-6232
Fax (714) 556-8715
